Using Sorting in Clustering

I use sorting all the time in my algorithms to simulate running nearest neighbor (see Section 2.4 of Vectorized Deep Learning), and what just dawned on me, is that I actually proved formally, that a list is sorted if and only if its adjacent entries have the minimum possible distance (see Theorem 2.1 of Sorting, Information, and Recursion). This implies, the resultant sorted list, provides you with the nearest neighbors of each element in the list. This in turn allows for a trivial adaptation of my core algorithms, where rather than take the norm of the distance between a given vector and all others, you simply take the norm of the difference between a given vector and the vectors in the order in which they’re sorted in the list. The advantage in that case, is that if you’re not running the algorithms truly in parallel (which is the case on consumer devices when you have too many rows), then you’re only performing one operation per comparison. Attached is an example using my supervised clustering algorithm, which increases the radius of a sphere, until it hits its first error, which in this case means simply increasing the index of a sorted list, until you encounter a classifier that is unequal to the classifier in question (i.e., the origin of the sphere). This produces really fast runtimes, running in about 10 seconds given 100,000 rows with 15 columns – This is pretty serious stuff, and will be included in the Massive Version of Black Tree AutoML, for just $999. A mutually exclusive version (i.e., non-intersecting clusters) would typically produce even faster runtimes, since the size of the effective dataset can reduce each iteration.

For a testing dataset, you could simply combine the training and testing datasets, store the entries of the testing rows, and then go out some radius from each testing row by checking the classifiers of the rows to the left and right of each testing row. Applying the attached approach (i.e., first error), you would proceed until you encountered more than one class. You could instead proceed by no more than some fixed distance, or some fixed number of entries. You could report the modal class, or simply report the entire cluster of classes as a prediction. This will be extremely fast, since you’re operating only on the testing rows and the adjacent training rows, rather than the entire training dataset (save for the sorting step). I’ve attached code that implements this method, which seems to work really well, though more testing is required. I’ve included a basic confidence metric that also seems to work, in that accuracy increases as a function of confidence. This code is applied to the MNIST Fashion Dataset, which makes use of image preprocessing algorithms you can find in my A.I. Library on ResearchGate, but you can also simply ignore the preprocessing, as everything past the heading, “Runs Prediction”, is generalized and requires only a dataset.

Here is a plot of accuracy as a function of confidence over the MNIST Fashion Dataset:

Superficial Versus Functional Unity

So I just came to an amazing insight on the nature of life, and other systems generally:

There’s a big difference between superficial unity (e.g., something looks like a single object), and functional unity (e.g., an atom behaves as a single object). We know of examples of arguably random systems like cellular automata that exhibit superficial unity (they literally contain triangle-shaped outputs or Sierpinksi Traingles). But that’s not the same thing as an atom, that generally interacts as a single unit, or a composite particle, that again, despite being a complex object, behaves as a single unitary whole in general when interacting with other systems. And the reason I think this is connected to life, is because at least some people claim the origin of life stems from random interactions –

This is deeply unsatisfying, and in my opinion, an incomplete explanation of what’s happening.

Think about the probability of randomly producing something as large and complex as a DNA molecule, that has deep unitary functions, that copies itself, consumes its environment, and ends up generating macroscopic systems, that are also functionally unitary –

This is a ridiculous idea. For intuition, generate random characters on a page, and try to run them in C++, or whatever language you like –

What’s the probability you’ll even produce a program that runs, let alone does something not only useful, but astonishing, and with an output that is orders of magnitude larger than the input program? There’s no amount of time that will make this idea make sense, and you’ll probably end up needing periods of time that exceed the age of the Universe itself. A simple for loop contains about 20 characters, and there are about 50 characters in scope in programming languages –

This is not realistic thinking, as a program of any real utility, will quickly vanish into the truly impossible, with even a simple given for loop having a probability that is around O(\frac{1}{10^{30}}). For context, there have been about O(10^{17}) seconds since the Big Bang. Let’s assume someone had a computer running at the time of the Big Bang, that could generate 1 billion possible programs per second. Every program generated is either a success or a failure, and let’s assume the probability of success is again p = O(\frac{1}{10^{30}}). The binomial distribution in this case reduces to,

\bar{p} = np(1-p)^{n-1},

where n is the number of trials and p is the probability of generating code that runs. Because we’ve assumed that our machine, that’s been around since inception, can test one billion possibilities per second, we would have a total number of trials given by n = 10^{26}. This yields a comically low probability that is \bar{p} = O(\frac{1}{10^4}), even given the absurd assumption, that calculations have been running since the Big Bang.

Expressed in these terms, the idea that life is the product of chance, sounds absurd, and it is, but this doesn’t require direct creationism, though I think philosophers and scientists are still stuck with the fact that the Universe is plainly structured, which is strange. Instead, I think that we can turn to the atom, and composite particles, for an intuition as to how a molecule as complex as DNA could come into being. Specifically, I think that high energy, high complexity interactions cause responses from Nature, that impose simplicity, and literally new physics:

The physics inside an atom, is not the same as the physics outside an atom;

The physics inside a composite particle, is not the same as the physics outside a composite particle.

This does not preclude a unified theory, but instead perhaps e.g., different subsets or instances of the same general rules apply under different conditions, and that the rules change as a function of energy and complexity. So if e.g., you have a high-energy event, that is high in complexity, at the scale of the atom, then perhaps, this could give rise to a system like DNA. This is however, distinct from random processes that produce superficial or apparent unity (i.e., it looks like a shape), and is instead a process of Nature that imposes functional unity on systems that are sufficiently high in energy and complexity.

I am in some sense calling into question at least some of the work of people like Stephen Wolfram, that from what I remember, argue that the behavior of automata can be used to describe the behavior of living systems. I think instead you can correctly claim that automata produce patterns that are superficially similar to e.g., the coloring and shapes you find in Nature, but that’s not the same as producing a dynamic and unitary system, that superficially has a resemblance to the patterns you find in that area of computer science generally. The idea being that you have a discrete change from a complex churning physical system, into a single ordered system that behaves as a whole, and has its own physics that are again, distinct from the physics prior to this discrete change. It’s the difference producing a static artifact, that again has elements that are similar to known objects, and producing a dynamic artifact with those same superficial qualities. What’s interesting, is that we know heavy elements are produced in stars, which are plainly very high energy, very complex systems. Now think about how much larger and complex DNA is compared to even a large atom. If this theory is correct, then we would be looking for systems that aren’t necessarily as large as stars, but perhaps have even greater energy densities and complexities –

That’s quite the conundrum, because I don’t think such things occur routinely if at all on Earth. I think the admittedly possibly spurious logic suggests that higher energy stars, specifically black holes, might be capable of producing larger artifacts like large molecules. The common misconception that nothing escapes a black hole is simply incorrect, and not because of Hawking’s work, but because black holes are believed to have a lifespan, just like stars. As a result, any objects they create, could be released –

The intuition would be, powerful stars produce heavy elements, so even more powerful stars, like black holes, could produce molecules. And because the physics of black holes is plainly high energy and complex, it’s a decent candidate.

However, even if all of this is true, and we are able to someday replicate the conditions that give rise to life, we are still stuck with the alarming realization that there are apparently inviolate rules of the Universe, beyond physics, the causes of which are arguably inaccessible to us. Specifically, the theorems of combinatorics are absolute, and more primary than physics, since they are not subject to change or refinement –

They are absolute, inviolate rules of the Universe, and as a result, they don’t appear to have causes in time, like the Big Bang. They instead follow logically, almost outside time, from assumption. How did this come to be? And does that question even mean anything, for rules that seem to have no ultimate temporal cause? For these reasons, I don’t think there’s a question for science there, because it’s beyond cause. This is where I think the role of philosophy and religion truly comes into play, because there is, as far as I can tell, no access to causes beyond the mere facts of mathematics. That is, we know a given theorem is true, because there is a proof from a set of assumptions that are again totally inviolate –

Counting will never be incorrect, and neither will the laws of logic. And so we are instead left with an inquiry into why counting is correct, and why logic is correct, and I don’t think that’s subject to scientific inquiry. It simply is the case, beyond empiricism, though you could argue we trust the process because it’s always been observed to be the case. But this is dishonest, because everyone knows, in a manner that at least I cannot articulate in words, that you don’t need repeated observation to know that counting is inviolate. Moreover, I don’t think this is limited to combinatorics, but instead, would include any theorems that follow from apparently inviolate assumptions about the Universe. For example, the results I presented in “Information, Knowledge, and Uncertainty” fit into this category, because they follow from a tautology that simply cannot be avoided. Further, the results I present in Section 1.4 of “A Computational Model of Time-Dilation” also fit this description, because all measurements of time, made by human beings, will be discrete, and so the results again follow from apparently inviolate assumptions about the Universe. And so we are stuck with the alarming realization that there are apparently inviolate rules of the Universe, the causes of which are arguably inaccessible to us. That is, the laws of combinatorics seem to be perennially true, that follow from idea itself, independent of any substance, and without succession from cause in time.

So in this view, even if the conditions of the origins of life are someday replicable, the real mystery is the context that causes life to spring into existence –

The causes of the laws of the Universe, being inaccessible, perhaps in contrast to the conditions that produce life.

To take this literally, the laws of combinatorics, actually exist, outside time and space, and yet impose conditions upon time and space, that are absolute and inviolate. This space, assuming it exists, would have a relational structure that is also absolute and inviolate, as the logical relationships among the theorems of combinatorics are also absolute and inviolate. It is in this view, only the peculiarity of our condition, that requires the progression through time, which allows for computation, and in turn, the discovery of these laws and relationships, whereas in reality, they simply exist, literally beyond our Universe, and are alluded to, by observation of our Universe. To return to the topic of life, without life, there would be no ideas, and instead, only the operations of their consequences (i.e., the undisturbed laws of physics). Because life exists, there is, in this view, a connection, between the space of ideas, and our Universe. To lend credence to this view, consider the fact that there are no constraints on the Universe, other than those imposed by some source. For example, the written laws of mankind, the limitations of the human body, the observed laws of physics, and ultimately, the theorems of combinatorics, which will never change. The argument above suggests that, therefore, the theorems of combinatorics have a source that is exogenous to both time and space, yet to deny a source to the most primordial and absolute restrictions of our Universe, seems awkward at best. Moreover, humanity’s progression through science has repeatedly struggled with that which is not directly observable by the human body, such as radio waves, magnetic fields, and gravity, yet we know something must be there. In this case, logic implies that the laws of combinatorics exist in a space, that by definition, must be beyond both time and space, though its consequences are obvious, and with us constantly, and so that space, must have dominion over time and space, and is, from our condition, absolute and inviolate.

I suppose if you consider, and if you believe, that the laws of mathematics themselves are the result of work, of design, then there is only a finite amount of work to do that follows, in light of what must be, a literally infinite amount of work to set the conditions that allow for life itself.

Rethinking My Original Work in A.I.

I introduced an unsupervised algorithm a while back that finds the geometric edge of a cluster, and it’s astonishingly efficient, and accurate, when you actually have data that is positioned in some kind of physically intuitive manner (e.g., macroscopic objects in 3D space). However, it’s not so accurate, when you’re dealing with even industry benchmark datasets. If in contrast, you use my supervised algorithm, accuracy is basically perfect. If you use my original approach, which is unsupervised, but tracks the rate of change in structure, over the entire dataset, as you increase the level of discernment, it works really well in general. This is surprising, because this third case is beyond the theorems I presented in the paper that defines the foundations of my work in A.I. Specifically, the piece that’s missing, is why this would be the correct value of delta. On a supervised basis, it’s trivial – it’s correct, because that’s what the training dataset tells you. In contrast, the unsupervised algorithm has no theoretical support, but it works astonishingly well. I’m thinking about this because I’m just starting to sell my work, and I don’t want to sell bull shit, but I don’t think anyone thinks this carefully anymore, so I’ve likely taken it a bit too far.

Rank Correlation and Randomness

I came up with a measure of rank correlation when I was living in Sweden, that I abandoned because I was working on A.I. and physics, and it turns out, I could use it, in order to calculate the correlation between confidence and accuracy. A user on Reddit pointed out to me that something similar is already known, named the Kendall Tau Rank Correlation. The difference between what I still believe to be an original measure of correlation, and the Kendall Tau measure, is that Kendall’s measure counts the number of unequal ordinals. In contrast, my measure takes the difference between corresponding ordinals, treating them as cardinal values, for this purpose (i.e., it’s not just that 3 is unequal to 5, it’s that the absolute difference is 2). As a result, if the sorting process moves an entry from the front of the list to back of the list, that’s a measurably bigger change, than moving that entry by one index. Putting aside the question of whether or not my measure is original, something truly strange has again appeared on my radar, and I ignored it the first time because I had too much to do:

Applying my measure, a list in random order, is closer to backwards, than forwards, as measured by rank correlation.

To unpack this, when you calculate rank correlation, what you’re doing is, taking two lists of numbers, sorting one, and using the resultant permutation of ordinals, to sort the second list of numbers. So for example, given x = (1,2,3,4,5) (i.e., the domain) and y = (1, 5, 3, 2, 6) (i.e., the range), sorting the range will produce the permutation-vector (1,4, 3, 2, 5), in that the position of the first entry of y is unchanged in the sorted list of y, the position of the second entry of y has moved to the fourth entry of the sorted list of y, and so on. My understanding is that Kendall Tau counts the number of unequal ordinals, so we would in this case compare, entry by entry, the vectors (1,2,3,4,5) == (1,4, 3, 2, 5). In that case, the second and fourth entries are unequal, with two entries contributing to our measure of correlation. Note that if two vectors are perfectly correlated, then the ordinals will not change, and so we would count a score of zero, all scores over zero therefore indicating a less than perfect correlation.

When calculating my presumably original measure of correlation, you would instead treat the ordinal values as cardinals, and so rather than count the number of discordant pairs, you would take the absolute value of their differences. So rather than comparing corresponding entries for equality, you would instead take the absolute value of the difference between corresponding vectors |(1,2,3,4,5) - (1,4, 3, 2, 5)| = (0, 2, 0, 2,0), and then take the sum, producing 4. As a consequence, position matters, and moving an entry, e.g., from the front of a list to the back is more significant, than a slight change in position.

So a backwards list would cause us to take the sum over the difference between the vectors C = \sum |(1,2,3, \ldots, N) - (N,N-1,N-2, \ldots, 1)|, which is given by Gauss’ formula.

 That’s not the interesting part –

The interesting part is, let M be the value of C, given a number of N items in reverse order (i.e., M is the value of C, given N elements, in a backward list). Now posit a random list, i.e., generate a randomly permuted list using a random number generator, and take the ratio of the value C, given that list, divided by M. Or, you can also take a linear function and incrementally scramble it, you find in both cases:

The ratio \frac{M}{C} seems to converge to \frac{2}{3}, as a function of N.

This suggests a random list is closer to backwards than sorted, using this metric.

There could be some basic math I’m missing, but this is interesting.

Specifically, both a perfectly sorted list and a perfectly backwards list have trivial Kolmogorov Complexities, and so, you would expect, intuitively, a random list to fall equally between the two, but this is just wrong, as it is plainly the case that when the rank correlation of a random list, is divided by the rank correlation of a backwards list, the ratio is roughly \frac{2}{3}, suggesting a random ordering is closer to a backwards list, than a forward sorted list. Again, both a forward sorted list and a backward sorted list have a trivial complexity:

How I Think About Machine Learning

I’m obviously working on the Pro Version of my AutoML software, Black Tree AutoML, and most of the work is simply restating what I’ve done in a manner that interacts with the GUI I’ve developed (pictured below). This in turn causes me to reconsider work I’ve already done, and so I thought it worthwhile to present again my basic views on Machine Learning, nearly six years after I started working on A.I. and Physics full-time, as they’ve plainly evolved quite a bit, and have been distilled into what is, as far as I know, humanity’s fastest Deep Learning software.

Basic Principles

In a series of Lemmas (see, Analyzing Dataset Consistency [1]), I proved that under certain reasonable assumptions, you can classify and cluster datasets with literally perfect accuracy (see Lemma 1.1). Of course, real world datasets don’t perfectly conform to the assumptions, but my work nonetheless shows, that worst-case polynomial runtime algorithms can produce astonishingly high accuracies:

DatasetAccuracyTotal Runtime (Seconds)
UCI Credit (2,500 rows)98.46%217.23
UCI Ionosphere (351 rows)100.0%0.7551
UCI Iris (150 rows)100.0%0.2379
UCI Parksinsons (195 rows)100.0%0.3798
UCI Sonar (208 rows)100.0%0.5131
UCI Wine (178 rows)100.0%0.3100
UCI Abalone (2,500 rows)100.0%10.597
MNIST Fashion (2,500 images)97.76%25.562
MRI Dataset (1,879 images)98.425%36.754
Table 1. The results above were generated using Black Tree’s “Supervised Delta Classification” algorithm, running on an iMac 3.2 GHz Core i5, and all datasets can be downloaded through blacktreeautoml.com, together with a Free Version of Black Tree capable of producing these results on any Mac with OS 10.10 or later.

This informs my work generally, which seeks to make maximum use of data compression, and parallel computing, taking worst-case polynomial runtime algorithms, producing, at times, best-case constant runtime algorithms, that also, at times, run on a small fraction of the input data. The net result is astonishingly accurate and efficient Deep Learning software, that is so simple and universal, it can run in a point-and-click GUI:

The GUI for the Free Version of Black Tree AutoML, available at, blacktreeautoml.com

Even when running on consumer devices, Black Tree’s runtimes are simply incomparable to typical Deep Learning techniques, such as Neural Networks, and the charts below show the runtimes (in seconds) of Black Tree’s fully vectorized “Delta Clustering” algorithm, running on a MacBook Air 1.3 GHz Intel Core i5, as a function of the number of rows, given datasets with 10 columns (left) and 15 columns (right), respectively. In the worst case (i.e., with no parallel computing), Black Tree’s algorithms are all polynomial in runtime as a function of the number of rows and columns.

Data Clustering

Spherical Clustering

Almost all of my classification algorithms first make use of clustering, and so I’ll spend some time describing that process. My basic clustering method is in essence really simple:

1. Fix a radius of delta (I’ll describe the calculation below);

2. Then, for each row of the dataset (treated as a vector), find all other rows (again, treated as vectors), that are within delta of that row (i.e., contained in the sphere of radius delta, with an origin of the vector in question). This will generate a spherical cluster, for each row of the dataset, and therefore, a distribution of classes within each such cluster.

The iterative version of this method has a linear runtime as a function of (M - 1) \times N, where M is the number of rows and N is the number of columns (note, we simply take the norm of the difference between a given vector, and all other vectors in the dataset). The fully vectorized version of this algorithm has a constant runtime, because all rows are independent of each other, and all columns are independent of each other, and you can, therefore, take the norm of the difference between a given row and all other rows, simultaneously. As a result, the parallel runtime is constant.

Calculating Delta

The simplest clustering method is the supervised calculation of delta: you simply increase delta, some fixed number of times, using a fixed increment, until you encounter your first error, which is defined by the cluster in question containing a vector that is not of the same class as the origin vector. This will of course produce clusters that contain a single class of data, though it could be the case, that you have a cluster of one for a given row (i.e., the cluster contains only the origin). This requires running the Spherical Clustering algorithm above, some fixed number of K times, and then searching in order through the K results for the first error. And so for a given row, the complexity of this process is, in parallel, O(K \times C + K) = O(C)
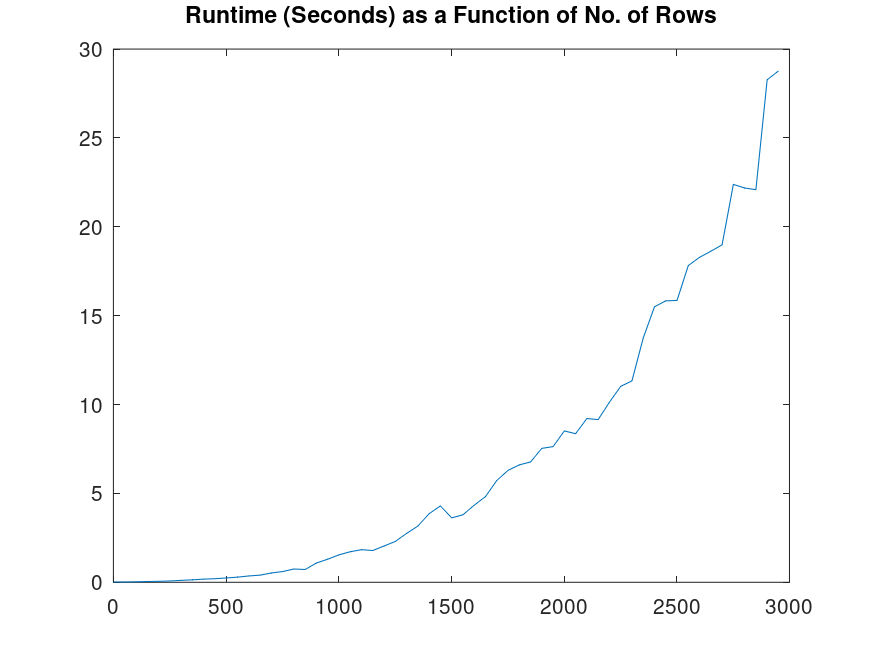
, again producing a constant runtime. Because all rows are independent of each other, we can run this process on each row simultaneously, and so you can cluster an entire dataset in constant time.

What’s notable, is that even consumer devices have some capacity for parallel computing, and languages like Matlab and Octave, are apparently capable of utilizing this, producing the astonishing runtimes above. These same processes run on a truly parallel machine would reduce Machine Learning to something that can be accomplished in constant time, as a general matter.

Supervised Classification

Now posit a Testing Dataset, and assume we’ve first run the process above on a Training Dataset, thereby calculating a supervised value of delta. My simplest prediction method first applies the Nearest Neighbor method to every row of the Testing Dataset, returning the nearest neighbor of a given vector in the Testing Dataset, from the Training Dataset. That is, for an input vector A in the Testing Dataset, the Nearest Neighbor method will return B in the Training Dataset, for which z = norm(A - B) is minimum over the Training Dataset (i.e., B is the Training Dataset vector that is closest to A).

The next step asks whether z \leq delta. If that is the case, then the vector A would have been included in the cluster for vector B, and because the clustering algorithm is supervised, I assume that the classifiers of A and B are the same. If z > delta, then that prediction is “rejected”, and is treated as unknown, and therefore not considered for purposes of calculating accuracy. This results in a prediction method that can determine ex ante, whether or not a prediction should be treated as “good” or “bad”.

I proved in [1], that if a dataset is what I call “locally consistent”, then this algorithm will produce perfect accuracy (see Lemma 2.3 of [1]). In practice, this is in fact the case, and as you can see, this algorithm produces perfect or nearly perfect accuracies for all of the datasets in Table 1 above.

Confidence-Based Prediction

Modal Prediction

In the example above, we first clustered the dataset, and then used the resultant value of delta to answer the question, of whether or not a prediction should be “rejected”, and therefore treated as an unknown value. We could instead look at the contents of the cluster in question, for information regarding the hidden classifier of the input vector. In the case of the supervised clustering algorithm above, the class of all of the vectors included in the cluster for B are the same, since the algorithm terminates upon discovering an error, thereby generating clusters that contain vectors of internally consistent classes. We could instead use an unsupervised process, that utilizes a fixed, sufficiently large value of delta, to ensure that as a general matter, clusters are large enough to generate a representative distribution of the classes near a given vector. We could then look to the modal class (i.e., the most frequent class), in a cluster, as the predicted class for any input vector that would have been included in that cluster.

This is the process utilized in my Confidence-Based Prediction algorithm, though there is an additional step that calculates the value of Confidence for a given prediction, which requires a bit of review of very basic information theory. Ultimately, this process allows us to place a given prediction on a continuous [0,1] scale of Confidence, unlike the method above, which is binary (i.e., predictions are either accepted or rejected). This in turn allows a user, not the algorithm, to say what predictions they would like to accept or reject.

Calculating Confidence

In another paper (see, Information, Knowledge, and Uncertainty [2]), I introduced a fundamental equation of epistemology, that connects Information (I), Knowledge (K), and Uncertainty (U), using the following equation:

I = K + U.

This simply must be the case, since all information about a given system is either known to you (your Knowledge), or unknown to you (your Uncertainty). It turns out that using the work of Claude Shannon, we can calculate U exactly, which he proved to be proportional to the Shannon Entropy of the distribution of states of a system (see Section 6 of, A Mathematical Theory of Communication [3]). Using my work in information theory, you can calculate I, which is given by the logarithm of the number of states of a system (see Section 2 of [2]). This in turn allows us to calculate Knowledge as the difference between these two quantities,

K = I - U.

I’ve shown that we can apply this equation to Euclidean vectors that contain integer values, in particular, an observed distribution of classes within a cluster (i.e., a vector of class labels) (see Section 3 of [2]). Since the modal prediction process above maps each row of a dataset to a cluster, we can then consider the related vector of classes (i.e., the classes of each row in the cluster), and therefore, assign a value of Knowledge to each row of a dataset.

Probabilities of course exist over the [0,1] interval of the Reals, whereas the formula for Knowledge above is unbounded over the Reals. We can, however, normalize the values of Knowledge for a given dataset, by simply dividing by the maximum value of Knowledge over the rows of the dataset, which will of course, normalize these values of Knowledge to the [0,1] interval.

I’ve also shown that modal prediction is more reliable as a function of increasing Knowledge and increasing modal probability (see Graph 1 below). That is, as both the modal probability of a given prediction, and the Knowledge associated with the underlying vector of classes, increase, the accuracy of the prediction also increases. This in turn implies the following equation for Confidence,

C = Minimum\{K,P\},

Where P is the modal probability of a prediction, and K is the normalized value of Knowledge of the prediction.

We can then plot accuracy, as a function of C, and as noted, I’ve shown that, as a general matter, accuracy increases as a function of Confidence.

Accuracy as a function of Confidence (not normalized, the x-axis shows the iteration number, with Confidence increasing each iteration) for the UCI Credit Dataset.

Cluster-Based Classifier Labels

This algorithm first clusters the entire dataset, generating mutually exclusive clusters. Then, it adds an additional classifier, that is not hidden, but is generated by the algorithm itself, and so the algorithm is unsupervised, overall. The label in question is produced by clustering the dataset, where if row i is clustered in the cluster for row j, then the additional classifier for row i is the number j. These clusters are mutually exclusive, ensuring a unique additional classifier for each row.

The idea is, you assign labels to rows using the actual structure of the dataset. That is, these labels are defined by the clusters to which each row belongs, and nothing else, and so there’s no human error possible, because the algorithm clusters the dataset on its own, on an unsupervised basis, which in turn defines the labels.

Then, prediction is run, where a new cluster is pulled for each row of the dataset. These clusters are not mutually exclusive. The modal additional class label is treated as the best prediction for a given row. So e.g., if the modal additional class for row i is j (i.e., among the rows in the cluster for row i, the most frequent additional classifier is j), then the predicted class for row i is the class for row j. In this second round of clustering, rows are never contained in their own clusters, and so the algorithm is totally unsupervised.

The accuracy is excellent, and apparently perfect for the following datasets:

UCI Credit

UCI Ionosphere

UCI Iris

UCI Parkinsons

UCI Sonar

UCI Wine

You can download all of these datasets through the Black Tree website.

Like many of my algorithms, bad predictions are flagged ex ante and “rejected”, though this is of course also unsupervised, and you can read about the process generally in my paper, Vectorized Deep Learning. Finally, this algorithm is much slower than my core algorithms, which take small fractions of a second per row of data to run. This is because this process is not vectorized, and cannot be fully vectorized, because the clusters are not mutually exclusive, which means there has to be an order in which clusters are assembled. Any code that isn’t below, can be found in my previous post on the topic.

Permutation-Based Clustering

I wrote this algorithm a while back, and revisited it because I plan to offer it in the Pro Version of my AutoML Software, Black Tree. The original version was supervised, this one is unsupervised, just for completeness. The nice thing about this algorithm is that the clusters are guaranteed to be non-empty. In short, the way it works is to first generate a few copies of the original dataset, and permute all of them. Then, it runs nearest neighbor on each increasing sized subsets of each of the permuted copies, which generates unique matches each iteration. Then there’s an external function that optimizes the clusters after the fact. I believe this to be all the underlying code, but if anything is missing, you can email me at charles@blacktreeautoml.com, or have a look at my last library upload, as functions should still have similar names, so just sort and look for anything that’s missing.

Iterative Clustering Algorithm

I’m working on the Pro Version of my AutoML software, Black Tree AutoML, and I’m including an iterative version of my core clustering algorithm, simply because Octave runs out of memory if the datasets are larger than a few thousand rows (vectorization requires a large number of copies of the original dataset). The only other change is to the calculation of the possible values of delta, in this case I’m using a value of delta from my statistical clustering algorithm, simply because the standard calculation produces values that are too small. I suspect that this is due to the large dimension of the dataset I’ve selected in this case. I think I may have already written this algorithm, since the vectorized version almost certainly followed from a previously iterative algorithm, but I don’t know where it is in my library, so here it is, possibly again.

Iterative Clustering