I realized the other day that the equations I present in Section 3.3 of my paper, A Computational Model of Time-Dilation, might imply that wave behavior will occur with a single particle. I need to go through the math, but the basic idea is that each quantized chunk of mass energy in an elementary particle is actually independent, and has its own kinetic energy. This would allow a single elementary particle to effectively sublimate, behaving like a wave. The point of the section is that on average, it should still behave like a single particle, but I completely ignored the possibility that it doesn’t, at least at times, because I wanted single particle behavior, for other sections of the paper. I was reminded of this, because I saw an experiment, where a single neutron plainly travels two independent paths. If the math works out, we could completely ditch superposition, since there’s no magic to it, the particle actually moves like a wave, but generally behaves like a single particle. That said, I think we’re stuck with entanglement, which seams real, and I still don’t understand how it works, but nothing about entanglement contradicts my model of physics.
science
Spatial Uncertainty and Order
I presented a measure of spatial uncertainty in my paper, Sorting, Information, and Recursion [1], specifically, equation (1). I proved a theorem in [1] that equation (1) is maximized when all of its arguments are equal. See, Theorem 3.2 of [1]. This is really interesting, because the same is true of the Shannon Entropy, which is maximized when all probabilities are equal. They are not the same equation, but they’re similar, and both are rooted in the logarithm. However, my equation takes real number lengths or vectors as inputs, whereas Shannon’s equations takes probabilities as inputs.
I just realized, that Theorem 3.2 in [1], implies the astonishing result, that the order of a set of observations, impacts the uncertainty associated with those observations. That is, we’re used to taking a set of observations, and ignoring the ordinal aspect of the data, unless it’s explicitly a time series. Instead, Theorem 3.2 implies that the order in which the data was generated is always relevant in terms of the uncertainty associated with the data.
This sounds crazy, but I’ve already shown empirically, that these types of results in information theory work out in the real world. See, Information, Knowledge, and Uncertainty [2]. The results in [2], allow us to take a set of classification predictions, and assign a confidence value to them, that are empirically correct, in the sense that accuracy increases as a function of confidence. The extension here, is that spatial uncertainty is also governed by an entropy-type equation, specially equation (1), which is order dependent. We could test this empirically, by simply measuring whether or not prediction error, is actually impacted by order, in an amount greater than chance. That is, we filter predictions, as a function of spatial uncertainty, and test whether or not prediction accuracy improves as we decrease uncertainty.
Perhaps most interesting, because equation (1) is order dependent, if we have an observed uncertainty for a dataset (e.g., implied from prediction error), and we for whatever reason do not know the order in which the observations were made, we can then set equation (1) equal to that observed uncertainty, and solve for potential orderings that produce values approximately equal to that observed uncertainty. This would allow us to take a set of observations, for which the order is unknown, and limit the space of possible orderings, given a known uncertainty, which can again be implied from known error. This could allow for implications regarding order that exceed a given sample rate. That is, if our sample rate is slower than the movement of the system we’re observing, we might be able to restrict the set of possible states of the system using equation (1), thereby effectively improving our sample rate in that regard. Said otherwise, equation (1) could allow us to know about the behavior of a system between the moments we’re able to observe it. Given that humanity already has sensors and cameras with very high sample rates, this could push things even further, giving us visibility into previously inaccessible fractions of time, perhaps illuminating the fundamental unit of time.
The Rate of Mutation of mtDNA
I’ve written in the past on the topic of the rate of mutation of mtDNA, in an attempt to calculate the age of mankind. It turns out, there really isn’t a good single answer to the rate at which human mtDNA mutates, and as a result, you really can’t come to any clear answer using mtDNA alone. And in fact, I realized the other day, that it seems to vary by maternal line. Specifically, some modern humans carry archaic mtDNA, in particular Heidelbergensis, Denisovan, and Neanderthal mtDNA. Other modern humans carry mtDNA that is basically identical to ancient mtDNA (e.g., 4,000 years old), but not archaic mtDNA (e.g., 100,000 years old). In particular, many modern humans globally carry Ancient Egyptian mtDNA, from about 4,000 years ago.
You can get an idea of the rate of mutation, by taking e.g., a modern human that has Denisovan mtDNA, and comparing that to a bona fide archaic Denisovan genome, count the number of changed bases, and then divide by the number of years since the archaic sample lived, which will produce a measure of the number of changed bases per year. This can of course be expressed as a percentage of the total genome size, which is what I’ve done below.
We can be a bit fancier about it, by comparing a given genome to many others, producing a distribution of the number of changed bases per year. The code below does exactly this, producing the average total percentage change, minimum total change, maximum total change, and standard deviation over all total changes. The comparison was made only to modern genomes, and so we can take the known (and plainly approximate) date of the archaic / ancient genome, and divide by the number of years to the present. This will produce a rate of change per year, which I’ve expressed as a rate of change per 1,000 years.
The results are as follows:
| Genome Type | Avg. Change | Min. Change | Max. Change | Std. Deviation | Genome Date | Avg. Change Per 1000 Years |
| Denisovan | 26.39% | 25.76% | 32.70% | 1.99% | 120,000 BP | 0.22% |
| Neanderthal | 3.74% | 2.79% | 36.60% | 3.27% | 80,000 BP | 0.047% |
| Heidelbergensis | 4.27% | 3.30% | 37.61% | 3.30% | 430,000 BP | 0.0099% |
| Ancient Egyptian | 3.74% | 0.17% | 35.23% | 8.32% | 4,000 BP | .935% |
Again, note that Denisovan, Neanderthal, and Heidelbergensis are all archaic humans. In contrast, the Ancient Egyptians are of course ancient, but not archaic. The dataset contains 664 rows, 76 of which are archaic or ancient, which leaves 588 rows for the comparisons produced above. As a result, even though the table above was produced using only 4 input genomes, the results were generated comparing each of the 4 input genomes to all 588 complete, modern human mtDNA genomes in the dataset. The plain implication is that modern human mtDNA is evolving faster than archaic human mtDNA, since, e.g., the Ancient Egyptian genome has an average total rate of change equal to that of the Neanderthals, despite having only 4,000 years to achieve this total change, in contrast to the roughly 120,000 years that have passed since the Neanderthal genome. Technically, we should only be testing genomes we believe to be descended from the archaic / ancient genomes, since e.g., it is theoretically possible that a modern person has mtDNA that predates the Ancient Egyptian genome, since mtDNA is so stable. That said, the bottom line is that this is a measure of the variability of a particular maternal line, and the amount of mutation cannot exceed that variability. For this and other reasons, more studies are required, but this is an interesting observation.
The code is below, the balance of the code can be found in my paper, A New Model of Computational Genomics.
Knowledge and Utility
I wrote a paper a while back called “Information, Knowledge, and Uncertainty” [1], that presents a mathematical theory of epistemology. I go on to apply it, showing that it can be used in machine learning to drastically improve the accuracy of predictions, using a measure of confidence that follows from the definitions in [1]. In some other research note that I don’t remember the name of, I pointed out that we can also think about a different kind of information that is conveyed through a proof. Specifically, that longer proofs correspond to more computational work, i.e., the work required to prove the theorem, which will have some number of deductive steps. Simply count the steps, the more steps there are, the more work required to prove the result. Now of course, you could have a “bad” and pointlessly long proof for a theorem. Simply posit the existence of a shortest proof, as an analog to the Kolmogorov Complexity. The number of steps in the shortest proof for a theorem is the depth of the theorem.
What caught my attention this morning is the potential connection between utility and the depth of a theorem. For example, the Pythagorean Theorem has very short proofs, and as a result, the shortest proof will necessarily also be short. Despite this, the Pythagorean Theorem is remarkably useful, and has undoubtedly been used relentlessly in architecture, art, and probably plenty of other areas of application. Now you could argue that there is no connection between depth and utility, but perhaps there is. And the reason I think there might be, is because I show that in [1], the more Knowledge you have in a dataset, the more accurate the predictions are, implying utility is a function of Knowledge, which has units of bits.
You can view the number of steps in a proof as computational work, which has units of changes in bits, which is different than bits, but plainly a form information. So the question becomes, is this something universal, in that when information is appropriately measured, that utility becomes a function of information? If this is true, then results like the Graph Minor Theorem and the Four Color Theorem could have profound utility, since these theorems are monstrously deep results. If you’re a cartographer or someone that designs flags, then the Four Color Theorem is already useful, but jokes aside, the point is, at least the potential, for profound utilization of what are currently only theoretical results.
As a self-congratulatory example, I proved a mathematical equivalence between sorting a list of real numbers and the Nearest Neighbor method [2]. The proof is about one page, and I don’t think you can get much shorter than what’s there. But, the point is, in the context of this note, that the utility is unreal, in that machine learning is reduced to sorting a list of numbers (there’s another paper that proves Nearest Neighbor can produce perfect accuracy).
I went on to demonstrate empirically that the necessarily true mathematical results work, in the “Massive” edition of my AutoML software BlackTree AutoML. The results are literally a joke, with my software comically outperforming Neural Networks by an insurmountable margin, with Neural Networks taking over an hour to solve problems solved in less than one second (on a consumer device) using BlackTree, with basically the same accuracy in general. Obviously, this is going to have a big impact on the world, but the real point is, what do the applications of something like the Graph Minor Theorem even look like? I have no idea. There’s another theorem in [2] regarding the maximization of some entropy-like function over vectors, and I have no idea what it means, but it’s true. I’ve dabbled with its applications, and it looks like some kind of thermodynamics thing, but I don’t know, and this is disturbing. Because again, if true, it implies that the bulk of human accomplishment has yet to occur, and it might not ever occur because our leaders are a bunch of maggots, but, if we survive, then I think the vast majority of what’s possible is yet to come.
All of that said, I’m certainly not the first person to notice that mathematics often runs ahead of e.g., physics, but I’m pretty sure I’m the first person to notice the connection (if it exists) between information and utility, at least in a somewhat formal manner. If this is real, then humanity has only scratched the surface of the applications of mathematics to reality itself, plainly beyond physics.
Determining Ancestral Flow Across Populations
In my paper, “A New Model of Computational Genomics” [1], I introduced an algorithm that allows you to test whether genome A is the ancestor of genomes B and C. You can read [1] to understand how it works, but for intuition, if both B and C begin identical to A, and then evolve independently in different environments, the number of bases they have in common going forward has to be the result of chance. Therefore, the genomes A and B, and A and C, should have more bases in common than B and C (i.e., both B and C deviate away from A independently of each other).
If we apply this test to three populations of genomes, instead of a single genome, we can count how many times the population A satisfied the inequality above, over all combinations of genomes selected from populations A, B, and C. Every time it is satisfied, we increment a counter associated with population A. We can then treat B and C as the ancestor (of course separately), again counting how many times the inequality is satisfied, producing a total of three counters. This will allow us to compare A, B, and C, and select the population that produced the greatest number of satisfied tests as the most likely to be the ancestor of the three populations. This is exactly what I did yesterday.
Each of the populations will again be associated with a counter that tells you how many times the inequality above is satisfied. If we divide by the total number of comparisons (i.e., the number of times we tested the inequality), we can produce a percentage. If e.g., we assume that Norway is the ancestor of Nigeria and Ancient Egypt, it turns out that test is satisfied 39.722% of the time. We can represent this as a graph with three vertices, one for each population, and a labelled edge running from the purported ancestor population to the two dependent populations. This is crudely represented below in my diagram, with an edge from Norway to both Nigeria and Ancient Egypt, labelled with the percentage of successful ancestry tests.

If we run the same tests again, this time treating each of Nigeria and Ancient Egypt as the ancestor population, we will produce an additional four edges, together producing a complete di-graph on three vertices in the form below. I nixed the labels for clarity, but did however include a new label “f”, representing the net percentage, and therefore net flow between the populations. This is easy to calculate, you just take the difference between e.g., the edge connecting A to B, and the edge connecting B to A, producing a single net figure from A to B. If the figure is positive, it means that A is more likely to be the ancestor of B, and if negative, that B is more likely to be the ancestor of A.
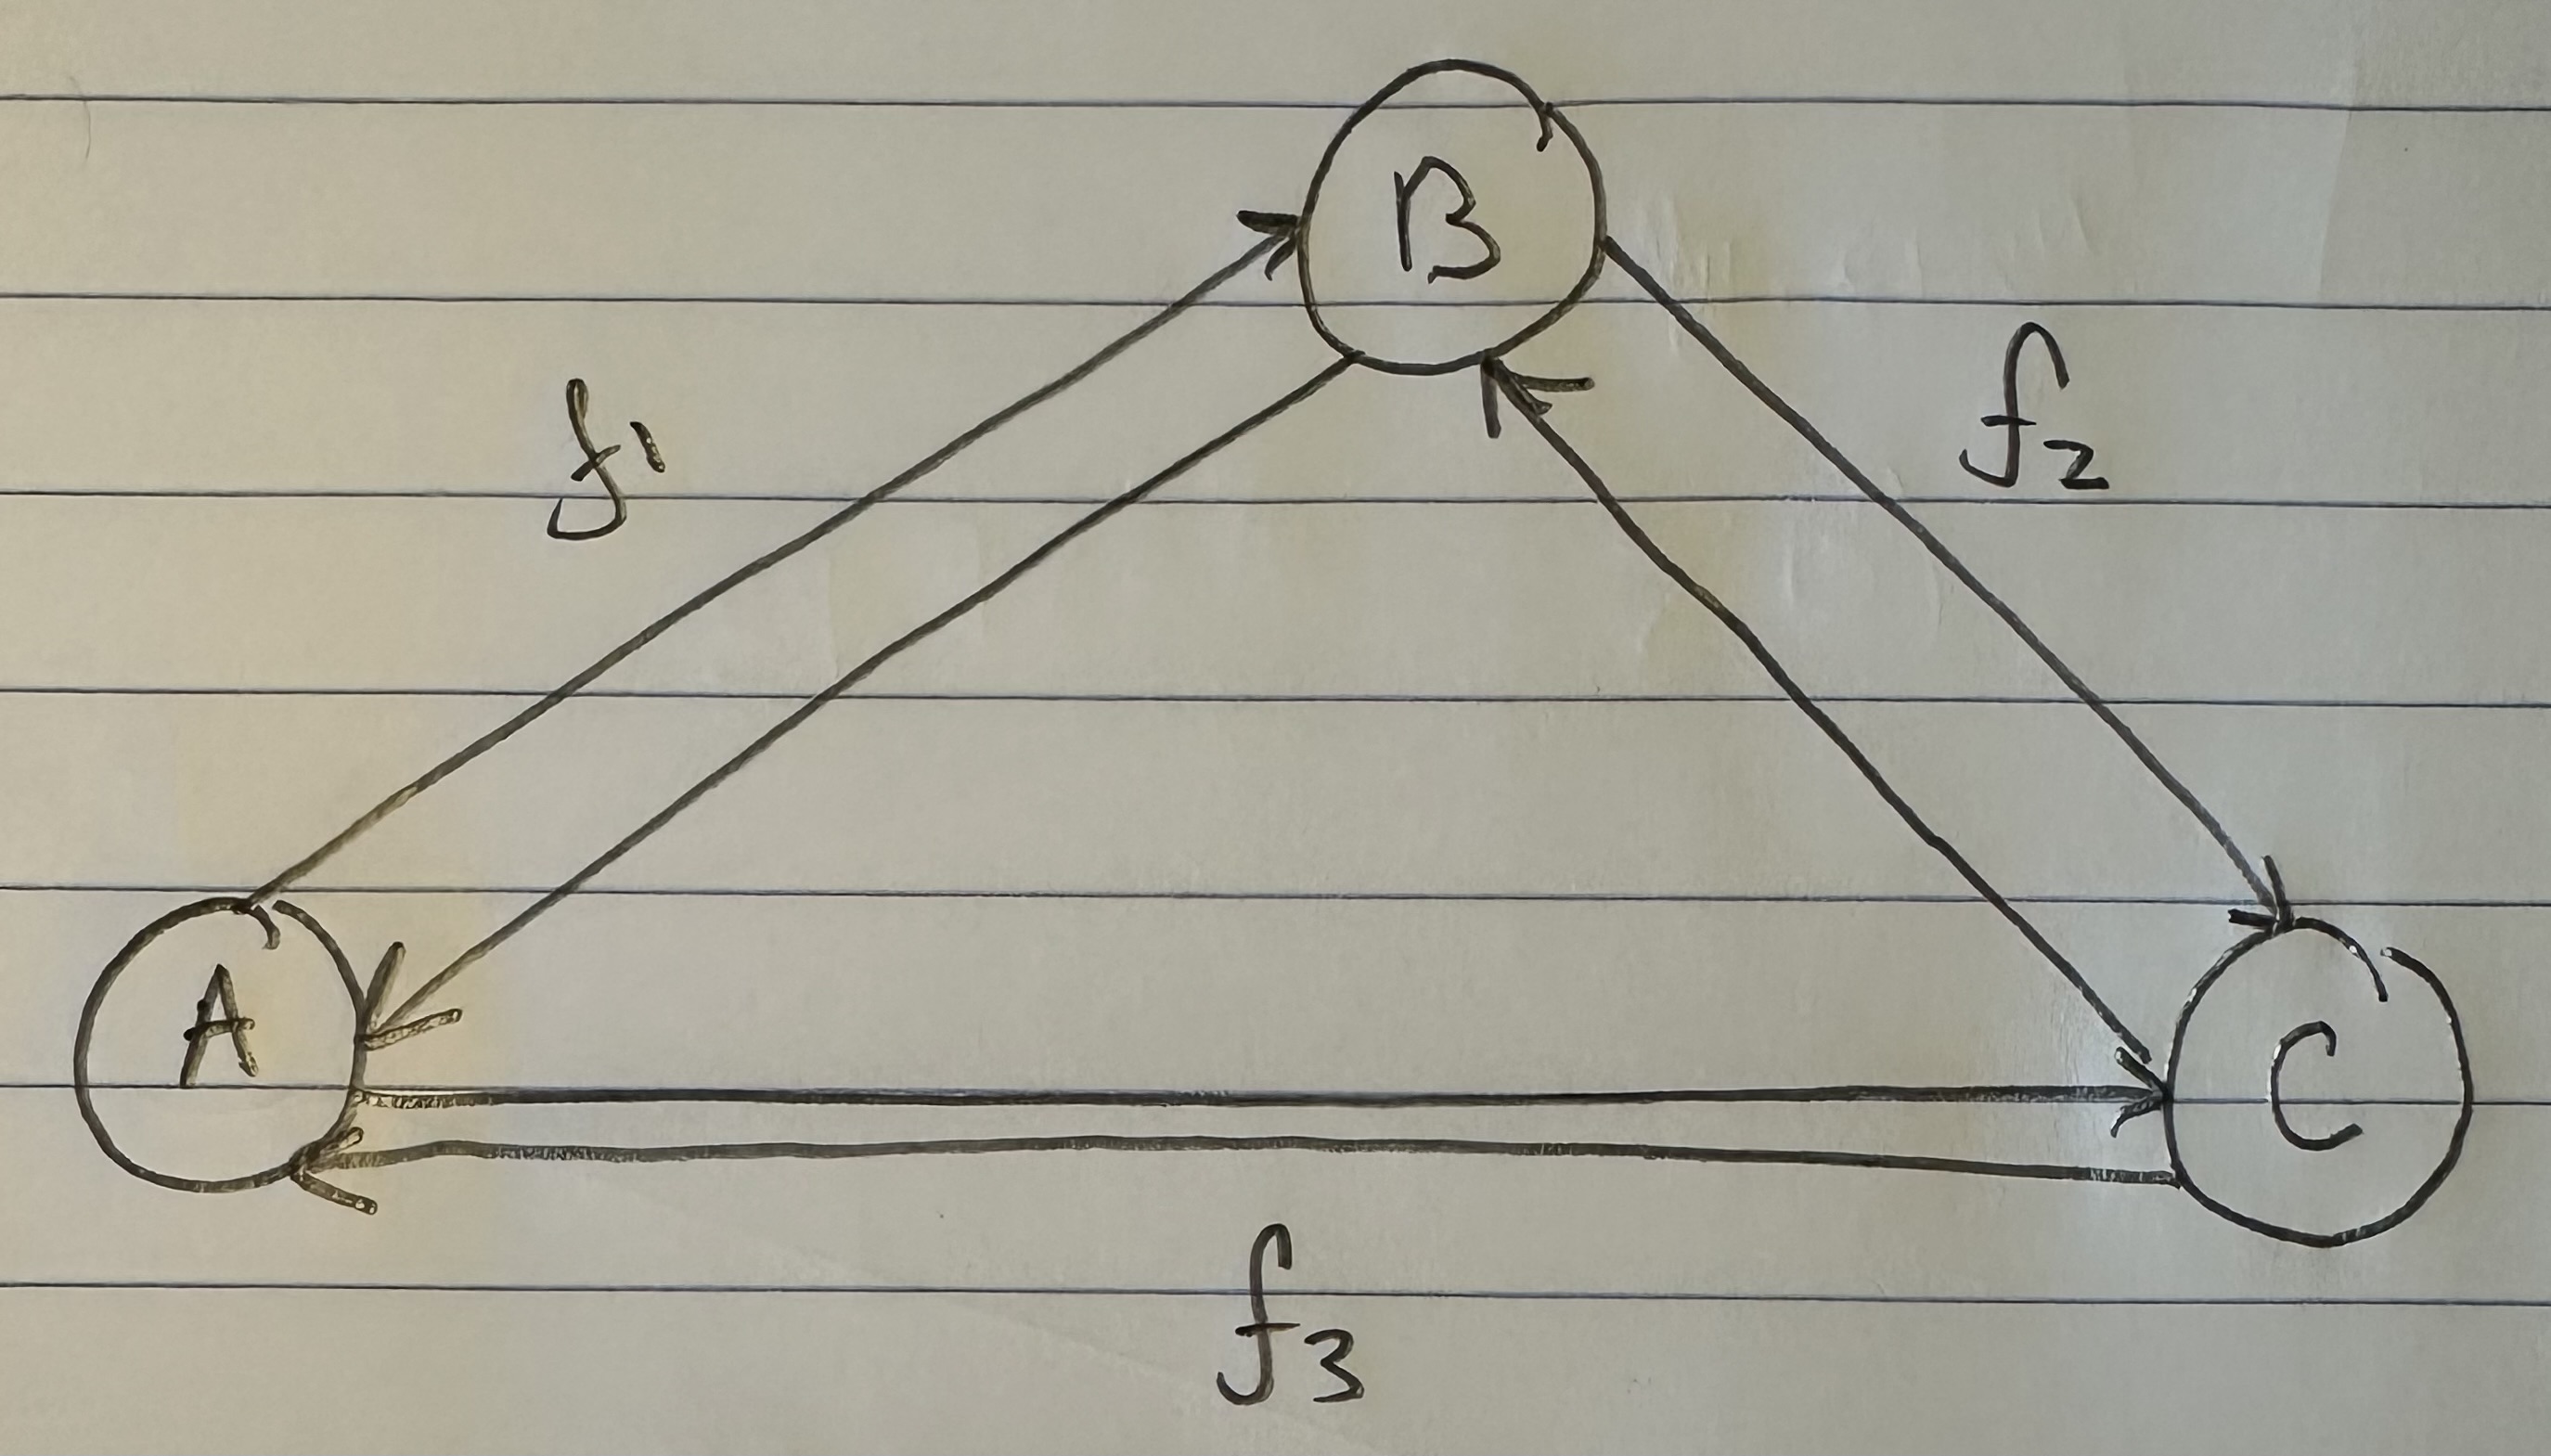
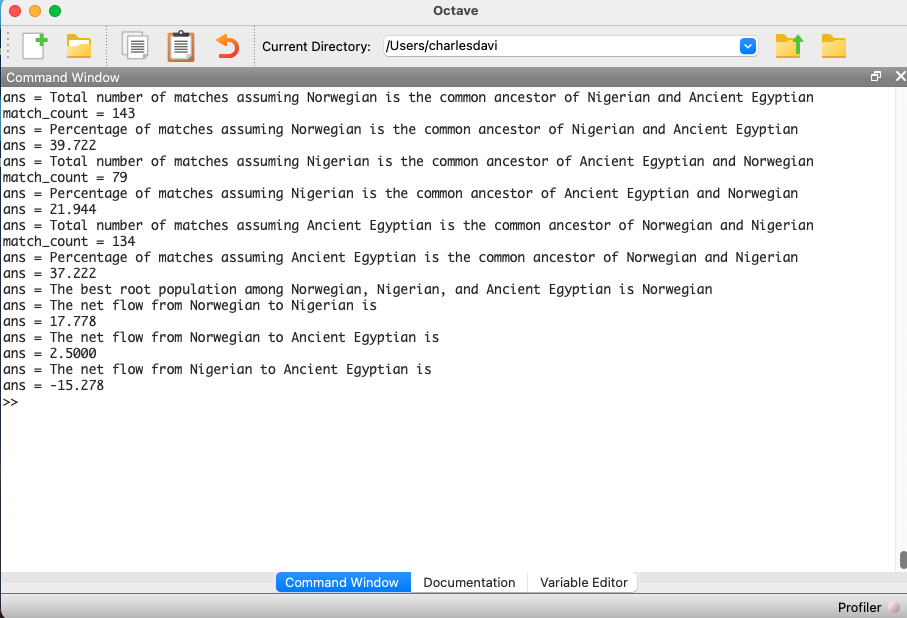
Below is some code that calculates the net flows for three populations, but I haven’t written any graph software yet (hence the “artwork” above). Astonishingly, Norway seems to be the root population for Nigeria and Ancient Egyptian. Now, this is subject to falsification, and there could be some other triplet of genomes that implies otherwise. That said, preliminary testing so far suggests that Northern Europeans, in particular Norwegians and Swedes, really might be the source population for a simply enormous number of people. And again, this could explain why South East Asians are literally white, genetically, which makes no sense, because it’s an extremely hot climate.
Interpreting the output below, we see that, in the context of the three populations, Norway is the best-fit ancestor of the Nigerians and Ancient Egyptians, and the Nigerians fit as a descendant of the Ancient Egyptians. What’s amazing about this, is you can use mtDNA, and literally impute geographic, directional flow, in this case, pointing mostly south, from Norway to West Africa and North East Africa. Thinking through all of this, it’s astonishing, because it’s just mtDNA, but you can literally project this onto a map, and determine geographic flows among populations.
This sounds crazy, Ancient Egyptians, they’re African! Sure, geographically, but when you look at their mtDNA, they appear to be South East Asian, and when you look at their artwork prior to Ancient Rome, they also look South East Asian. One sensible explanation, is that after the last Ice Age, about 10,000 years ago, populations that were otherwise stuck in Scandinavia started migrating. They don’t have to conquer to spread, they just have to survive with a higher probability than other populations. Given that they likely lived through Hell in a frozen tundra, once conditions improved, I think it’s perfectly sensible to assume that they survived with a higher probability than many other populations. This would cause them to spread without conquest, which seems to be the case, and I think what happened is, they ended up in South East Asia, migrating by foot (note Norwegians also test as the ancestor of Mongolians, Chinese, and Indian people, consistent with this hypothesis). Then, I think a group of South East Asians came back to the Middle East and North Africa (specifically the Pre-Roman Egyptians) by boat, which kicked off the ferocious competition of the Classical World. This is also consistent with the fact that the modern day Sri Lankans and Phoenicians are literally identical on the maternal line. This makes no sense, in the absence of interactions between the Classical World (or prior) and Asia. Also, there are obviously Asian Churches in Norway and several Buddha statues found at Viking sites. I don’t know for sure, because I’m only looking at mtDNA, but common sense suggests it’s something like this, otherwise you don’t have white people in a tropical climate like Thailand. I’ve been there, and I got horrible sunburn, it doesn’t make sense, absent an explanation like this.
Here’s the code, the dataset and any missing code can be found in [1].
Ancestry Test Code
As I’ve noted several times, I’ve devised an ancestry test that is impossible to argue with, using whole-genome mtDNA. See Section 6.1 of A New Model of Computational Genomics [1]. Specifically, given whole-genomes A, B, and C, if genome A is the ancestor of both genomes B and C, then it must be the case with near certainty that genomes A and B, and A and C, have more bases in common than genomes B and C. Again, see [1] for an explanation. The test in Section 6.1 of [1] is at the genome level, and as such, using a dataset of genomes, the number of tests required to compare whether an entire population is the ancestor of two other populations grows quickly as a function of population sizes. As a tractable approximation, the attached code uses the average match count between populations A and B, A and C, and B and C, which of course loses information, but should at least help you reduce the number of cases that you investigate exhaustively.
Applying the attached, it turns out, that yet again, the Denisovans test as the common ancestor of humanity (though I now think the Cameroon might be more modern than I first suspected), specifically, the common ancestor of both Heidelbergensis and Neanderthals. Further, the Phoenicians again test as the common ancestor of basically everyone alive today, including the modern Thai, Nigerians, Norwegians, Koreans, the Saqqaq (in B.C. Greenland!), the Swedes, Indians, and Chinese. As a result, I’m fairly convinced early Middle Eastern people settled a significant portion of Europe and Asia, and possibly America (given Greenland), but I can’t put a date on it. Ugarit goes back to 6,000 BC, which should leave enough time, but this is an ordinal test only, and therefore cannot be used to date the relationships. Moreover, I’ve recently cast serious doubt on the idea that mtDNA has a single, stable rate of mutation. The net point is, therefore, the ancestry test is real, and very difficult to argue with, but limited to ordinal testing; further, mtDNA doesn’t seem to have a single, stable rate of mutation; as a result, it looks plausible (1) that the Denisovans are the first humans and (2) that either the Phoenicians or people close to them (on the maternal line) we’re prolific settlers, but we don’t know when either got started.
The code is below, the balance can be found in [1]. One modification I plan to make is to use Monte-Carlo probing on the data that informs the averages. This will allow you to test a fixed portion of the genome-level data that you can scale given the power of your machine. BTW I just bought a Mac Mini running the M2 Pro chip, and I cannot recommend this machine enough, it is more than 10 times faster than my windows laptop. Running the ancestry test described above over 673 full mtDNA genomes takes about 0.5 seconds. I cannot believe this is a retail machine.
On the Age of Humanity
Introduction
My research shows unequivocally, that archaic humans are still alive today, in that many living humans carry archaic mtDNA. The obvious question is, how did archaic humans survive for so long? The answer is, they probably didn’t, but their mtDNA did, just like the widely accepted fact that many living humans carry archaic DNA generally. What makes mtDNA unique, is that it is so stable, passed from a mother to its offspring, with basically no mutations at all, even over thousands of years. One estimate claims that one mutation occurs roughly every 7,990 years, though this estimate is qualified and plainly subject to doubt. I show below that assuming this is correct, Denisovan mtDNA existed about 38,000,000 years ago.
This is obviously way earlier than anyone thinks, but it’s not totally absurd, especially in light of relatively recent finds, including Graecopithecus, which was dated to 7.2 million years ago, in Greece, not Africa, which of course implies it’s possible the species emerged much earlier in Africa itself. Also note that we’re only discussing mtDNA, not the full genome. As a result, the claim is limited to the existence of Denisovan mtDNA, not the full genome. The discussion below of course considers the case that the estimate of 7,990 years per mutation is simply wrong, which is arguably the point of this note. Specifically, not all systems have stable averages over time, and a system as complex as the human genome of course might not behave in a predictable, stable manner.
Alignment, Insertions, and Deletions
Assume you have two copies of the exact same genome, and call them A and B. Note that mtDNA is N = 16,579 bases long, and as a result, the match count between genomes A and B is 16,579 bases, or 100% of the genome. Now insert a random base in genome B, at index 2. This will shift every base after the first index in B, by 1 position. This should cause the remaining N-1 bases to match to genome A about 25% of the time. That is, because we’ve shifted one of the otherwise identical genomes by one base, whatever bases that happen to match post insertion, should be the result of chance, and because there are four possible bases, the probability of a match is 1/4. Note that a deletion will cause an analogous reduction to chance. As a result, a single insertion or deletion will cause the match count to drop to around chance, after the index of the insertion or deletion.
The work I present in, “A New Model of Computational Genomics” [1], makes use of a global alignment, which means that when comparing two genomes, you assign each base an index, and the comparisons are made by testing whether the bases are equal at each index. The match count is simply the total number of matching bases. See [1] generally. In contrast, local alignments take segments from a given genome A (e.g., bases 1 through 100), and attempt to find the highest match count anywhere in genome B (e.g., bases 100 through 200). This would therefore, ignore insertions and deletions, since e.g., in the example above, a local alignment would search all of genome A for the best match, which would produce a match count of N (i.e., 100% of the genome), with one “gap” to account for the insertion. In contrast, a global alignment (i.e., just counting matching corresponding bases) would produce a match count of 1 + approximately 0.25*(N-1) (i.e., the first matching base, plus approximately 25% of the remaining N-1 bases).
Insertions and deletions are, at least anecdotally, very impactful in terms of the affect they have, since, e.g., Williams Syndrome, Down Syndrome, and many others, are caused by insertions and deletions. As a result, it’s not surprising that local alignments don’t seem terribly useful in terms of predictive power, because they effectively ignore insertions and deletions, creating very high match counts across all human mtDNA. In contrast, the software in [1], makes use a global alignment, which ultimately allows ethnicity to be predicted with approximately 80% accuracy.
Application to Data
As noted in [1], and many other research notes I’ve written, there are plenty of modern living humans with archaic mtDNA, in particular, Denisovan mtDNA. Denisovans test as the common ancestor of all archaic humans, suggesting that they are in fact the first humans. Though technically the modern people of Cameroon test as the ancestors of the Denisovans, which is again possible because mtDNA is so stable, I’ll work instead with the actual Denisovan genomes in my dataset, which were all taken from the NIH database. The goal of this section is to approximate the date of the first Denisovans, given the genomes of modern living humans that carry Denisovan mtDNA, and the actual Denisovan genomes recovered from Siberia. There are 8 such Denisovan genomes in the dataset, out of a total of 664 genomes. All genomes are complete mtDNA genomes, again taken from the NIH database.
If we fix a minimum match threshold of 50% of the genome, we find that 82 non-Denisovan genomes are at least a 50% match to at least one Denisovan genome. These are living, modern humans that carry Denisovan mtDNA. The average match count over all such genomes is 11,779.32 bases, or 71.05% of the full genome. This means that since the Denisovan cave, 100% – 71.05% = 28.95% of the genome has mutated. This is 4,799.62 bases.
Though the rate at which mtDNA mutates is still a subject of discussion, as noted above, one cited figure is one mutation per 7,990 years. This would put the age of the Siberian Denisovans at 38,348,963.80 years before the present. This is way out of the ballpark for the low-end of what I’ve seen regarding the dates of these finds, which is around 300,000 years ago. As noted above, it’s at least possible that the modern living Denisovans instead carry the mtDNA of the ancestors of the Siberian Denisovans, which would again force us to reject the date of 38,348,963.80 years before the present. However, the data suggests this is not the case. See Section 6 of [1] generally.
It could also be the case that a single insertion or deletion is causing the match count to drop to around 70% of the genome when comparing the Siberian Denisovans to modern living humans. That is, there’s a single insertion or deletion further down the genome that causes the balance of the genome match count to drop to around 70%. This would not require that much time, since it is technically a single mutation. We can however rule this out by looking at the distribution of the matching bases along the genome. This can be done by grouping sequential bases (i.e., bases 1 through K, K+1 through 2K, etc), and then counting the percentage of matching bases in those segments. If the matching percentage of bases in each segment is always significantly above 25%, then it simply cannot be the case that the resultant match count is due to a single insertion or deletion within a given segment. The chart below shows the average percentage of matching bases for all 8 of the Siberian Denisovan genomes when compared to all other genomes that have at least a 50% match, breaking the full genome into 100 segments of 165 bases each.

You can plainly see that it’s not the result of a single insertion or deletion, since the match count is always above 40% of the bases in each segment. That said, there is still plainly a portion of the genome from around segment 5 to segment 40, that seems to have been impacted by insertions and deletions, but this is distinct from a single trivial insertion or deletion. As a result, we have an enormous amount of change to account for when comparing Siberian Denisovan mtDNA to the mtDNA carried by some modern, living humans. This again implies that either the estimated rate of mutation is wrong (probably correct) or the dates associated with the Siberian cave are way off (not as convincing). The software for this is below, and the balance of the software can be found in [1].
mtDNA and IQ
Introduction
I’ve noticed in the past that Finns have significantly higher IQ’s than the Swedes and Norwegians. This is in my opinion the group of people to study if you’re interested in the nature of intelligence, because they’re all very similar people, from roughly equally rich nations, in the same part of the world, which should allow innate ability to take control. One notable difference is that the Finns speak an Uralic language, whereas the Norwegians and Swedes speak a Germanic language. There could be something to this, but investigating the problem again today led me to what seems an inescapable conclusion, that whatever the connection is between mtDNA and intelligence, it simply cannot account for the distribution of IQ as it exists.
Instead I now believe that brain structure is the most important factor in intelligence, which simply cannot be controlled by mtDNA in any credible way. Specifically, my thinking is rooted in algorithmic complexity, that if you have two equally powered machines, running different algorithms that accomplish the same task, then the machine with the more efficient algorithm of the two will be the most powerful of the two. Translated to biology, if you have two brains that both consume the same amount of power per unit of time, and have the same “clock rate”, one brain could still be vastly more powerful than the other, due simply to different structure. This could explain e.g., the fact that some birds can talk, whereas some dogs will eat until they vomit, despite the fact that birds have brain volumes that are a small fraction of a dog’s brain volume.
mtDNA and Intelligence
Despite the apparent complexity of the subject, this is going to be a short note, because the idea that mtDNA controls for IQ is apparently nonsense, despite the scholarship on the topic (not picking on anyone, but here’s a decent article that runs through some credible arguments for the role of mtDNA in intelligence). But as you’ll see, whole-genome sequencing throws the argument in the garbage.
There’s no nice way to say this, but the Roma people have pretty low IQs, but what’s most interesting about them, is that they are basically identical to each other, and all other people of that maternal line, including about 100% of Papuans, 67% of Russians, and about 30% of Taiwanese people. If you want to test the results yourself, you can see my paper, “A New Model of Computational Genomics” [1], which includes all the software, and a detailed walkthrough to explain how I end up with these numbers. At a high level, the Papuans, Russians, and Taiwanese people in this group of Roma lineage, are all a 99% match to the Iberian Roma, with respect to their mtDNA. If mtDNA controlled intelligence, then all of those populations should have similarly low IQ’s, since they’re basically identical to the Roma. This is just not true, and instead the Taiwanese have around the highest and second highest IQ on Earth, and the Russians have roughly the same IQ as the Norwegians and Swedes, despite the fact that Russia is, quite frankly, poor and dysfunctional compared to Norway and Sweden.
One important note, though you’ll often hear that “humans are 98% monkey”, or some nonsense like that, the algorithms in [1] use what’s called a global alignment, and as a consequence, they’re extremely sensitive to changes in position, causing e.g., the Roma to have little more than chance in common with some people (i.e., about 25% of the mtDNA bases). This sensitivity is probably why the software in [1] is so powerful, and is able to predict ethnicity with about 80% accuracy, using mtDNA alone (which is pretty amazing). In contrast, NIH’s BLAST algorithm uses a local alignment, and so it deliberately seeks to maximize the number of matching bases, by shifting two genomes around, causing everyone to look the same, and therefore, throwing away valuable information about the genome.
Getting back to the core topic, if you pay attention to this limited set of facts, mtDNA is in the garbage as a driver of intelligence, and moreover, the role of poverty is not exactly clear either, since Russia is really poor compared to Norway and Sweden, and yet they have roughly the same IQs. So what is driving this? Cynically, I think IQ testing is really just testing for basic education (when you look at a map), which is absent in the truly poorest countries, but that doesn’t mean that we can’t debunk the connection between mtDNA and intelligence. But to be clear, I do think intelligence is genetic, and in anomalous cases like Finland, Cambodia, and Suriname, IQ becomes something interesting, because it’s at least a test. I just doubt it’s mtDNA driving the bus.
Some Answers from Computer Science
Even if we posit arguendo (which is not very nice) that there’s something wrong with Roma mtDNA, this would simply imply that they have low energy per unit of time, perhaps as a function of fixed caloric intake and environment. To make this less abstract, let’s fix a Norwegian guy (not Roma) and a Russian guy (Roma), and give them the same food, education, climate, environment, clothes, etc., over a lifetime. Under this assumption, the Russian guy will produce less energy over his lifetime, and therefore, his brain has a lower output. But this is garbage as an argument, for mechanical reasons: if the Russian guy has a more efficient brain, then he doesn’t need as much power to run his brain. As a consequence, his output over a lifetime could in fact be higher.
To make things completely concrete, if you use a brute force method to sort a list of 10 letters, you’ll have to perform 10! = 3,628,800 calculations. If you instead use my parallel method, you’ll have to make between 3 and 4 calculations. As you can plainly see, there is an ocean between these two approaches to solving even the simple problem of sorting a list. As a consequence, the most sensible answer is, in my opinion, that brain structure controls for intelligence, for the simple reason, that it encodes the algorithms we use to solve the problems we face every day. Some people have fast ones, some people have dumb ones, and then there’s (probably) most people in the middle.
Returning to the birds versus dogs analogy, I think it’s not ridiculous to argue that birds have vastly more efficient brains than dogs, that something along the lines of computational efficiency is taking place in the brain of a bird, that allows it to perform complex tasks, with a smaller, presumably lower-energy brain. For the same reasons, this could explain the obvious fact that some people are wildly more intelligent than others, despite (possibly) having the same maternal line. Because intelligence varies within a given ethnicity, I can tell you that you are e.g., Norwegian, with high accuracy using just your mtDNA, but there’s no way of knowing (to my knowledge) whether you’re one of the dumb ones. This doesn’t preclude identifying deficiencies in mtDNA that will make you dangerously ill, and therefore not very bright, but it just doesn’t make sense that the means of power-production controls the most complex structure in the Universe –
It’s a single bean, in an ocean of genetic information.
Measuring Uncertainty in Ancestry
In my paper, A New Model of Computational Genomics [1], I presented an algorithm that can test whether one mtDNA genome is the common ancestor of two other mtDNA genomes. The basic theory underlying the algorithm is straightforward, and cannot be argued with:
Given genomes A, B, and C, if genome A is the ancestor of genomes B and C, then it must be the case that genomes A and B, and A and C, have more bases in common than genomes B and C. This is a relatively simple fact of mathematics, that you can find in [1], specifically, in footnote 16. However, you can appreciate the intuition right away: imagine two people tossing coins simultaneously, and writing down the outcomes. Whatever outcomes they have in common (e.g., both throwing heads), will be the result of chance. For the same reason, if you start with genome A, and you allow it to mutate over time, producing genomes B and C, whatever bases genomes B and C have in common will be the result of chance, and as such, they should both mutate away from genome A, rather than developing more bases in common with each other by chance. This will produce the inequalities |AB| > |BC| and |AC| > |BC|, where |AB| denotes the number of bases genomes A and B have in common.
For the same reason, if you count the number of matches between two populations at a fixed percentage of the genome, the match counts between populations A, B, and C, should satisfy the same inequalities, for the same reason. For example, fix the matching threshold to 30% of the full genome, and then count the number of genomes between populations A and B that are at least a 30% match or more to each other. Do the same for A and C, and B and C. However, you’ll have to normalize this to an [0,1] scale, otherwise your calculations will be skewed by population size. My software already does this, so there’s nothing to do on that front.
By iteratively applying the population-level test for different values of M, we can also generate a measure of uncertainty associated with our observation. That is, not only can we test whether the inequalities are satisfied, we can also generate a measure of uncertainty associated with the test.
Specifically, fix M to some minimum value, which we select as 30% of the full genome size N, given that 25% is the expected matching percentage produced by chance, and 30% is meaningfully far from chance (again, see Footnote 16 of [1]). Further, note that as M increases, our confidence that the matches between A and B and A and C, are not the result of chance, increases. For intuition, note that as we increase M, the set of matching genomes can only grow smaller. Similarly, our confidence that the non-matching genomes between B and C will not be the result of chance decreases as a function of M. For intuition, note that as we increase M, the set of non-matching genomes can only grow larger.
As a result the minimum value for which the inequalities are satisfied informs our confidence in the B to C test, and the maximum value of M for which the inequalities are satisfied informs our confidence in the A to B and A to C tests. Specifically, the probability the B to C test is the result of chance is informed by the difference between the minimum M – N25%, whereas the A to B and A to C tests are informed by the difference N – M, where M is the maximum M. Note this difference is literally some number of bases, that is in turn associated with a probability (see again, Footnote 16 in [1]), and a measure of Uncertainty (see Section 3.1 of [1]). This allows us to first test whether or not a given population is the common ancestor of two other populations, and then further, assign a value of Uncertainty to that test.
Phoenicians as Common Ancestor
In a previous article, I showed that the people of Cameroon test as the ancestors of Heidelbergensis, Neanderthals, and Denisovans, with respect to their mtDNA. The obvious question is, how is it that archaic humans are still alive today? The answer is that they’re probably not truly archaic humans, but that their mtDNA is truly archaic. This is possible for the simple reason that mtDNA is remarkably stable, and can last for thousands of years without changing much at all. However, there’s still the question of where modern humans come from, i.e., is there a group of people that test as the common ancestors of modern human populations. The answer is yes, and it’s the Phoenicians, in particular, a group of mtDNA genomes found in Puig des Molins. Astonishingly, the Phoenicians test as the common ancestor of the Pre-Roman Egyptians (perhaps not terribly astonishing), and the modern day Thai and Sri Lankans, the latter two being simply incredible, and perhaps requiring a reconsideration of purported history.
The overall test is straight forward, and cannot be argued with: Given genomes A, B, and C, if genome A is the ancestor of genomes B and C, then it must be the case that genomes A and B, and A and C, have more bases in common than genomes B and C. This is a relatively simple fact of mathematics, that you can find in my paper, A New Model of Computational Genomics [1], specifically, in footnote 16. However, you can appreciate the intuition right away: imagine two people tossing coins simultaneously, and writing down the outcomes. Whatever outcomes they have in common (e.g., both throwing heads), will be the result of chance. For the same reason, if you start with genome A, and you allow it to mutate over time, producing genomes B and C, whatever bases genomes B and C have in common will be the result of chance, and as such, they should both mutate away from genome A, rather than developing more bases in common with each other by chance. This will produce the inequalities |AB| > |BC| and |AC| > |BC|, where |AB| denotes the number of bases genomes A and B have in common.
For the same reason, if you count the number of matches between two populations at a fixed percentage of the genome, the match counts between populations A, B, and C, should satisfy the same inequalities, for the same reason. For example, fix the matching threshold to 30% of the full genome, and then count the number of genomes between populations A and B that are at least a 30% match or more to each other. Do the same for A and C, and B and C. However, you’ll have to normalize this to an [0,1] scale, otherwise your calculations will be skewed by population size. My software already does this, so there’s nothing to do on that front.
In this case, I’ve run several tests, all of which use the second population-level method described above. We begin by showing that the Phoenicians are the common ancestor of the modern day Sri Lankans and Sardinians. For this, set the minimum match count to 99.65% of the full genome size. This will produce a normalized score of 0.833 between the Phoenicians and Sri Lankans, and 0.800 between the Phoenicians and Sardinians. However, the score between the Sri Lankans and the Sardinians is 0.200, which plainly satisfies the inequality. This is consistent with the hypothesis that the Phoenician maternal line is the ancestor of both the modern day Sri Lankans and Sardinians. Setting the minimum match count to 88.01% of the genome, we find that the score between the Phoenicians and the Pre-Roman Egyptians is 0.500, and the score between the Phoenicians and the Sri Lankans is 1.000. The score between the Pre-Roman Egyptians and the Sri Lankans is instead 0.000, again satisfying the inequality. This is consistent with the hypothesis that the Phoenicians are the common ancestor of both the Pre-Roman Egyptians and the modern day Sri Lankans.
This seems peculiar, since the Phoenicians are Middle Eastern people, and the genomes in question are from Ibiza. However, the Phoenicians in particular were certainly sea-faring people, and moreover, civilization in the Middle East goes back to at least Ugarit, which could date as far back as 6,000 BC. Though not consistent with purported history, this at least leaves open the possibility that people from the Middle East traveled to South Asia. This might sound too ambitious for the time, but the Phoenicians made it to Ibiza from the Middle East, which is roughly the same distance as the Middle East to Sri Lanka, both of which are islands. Once you’re in South Asia, the rest of the region becomes accessible.
If this is true, then it shouldn’t be limited to Sri Lanka, and this is in fact the case. In particular, the Thai also test as the descendants of the Phoenicians, using the same analysis. Even more interesting, both the modern day Norwegians, Swedes, and Finns test as the descendants of the Thai, again using the same analysis. Putting it all together, it seems plausible that early Middle Eastern civilizations not only visited but settled South Asia, and that some of them came back, in particular to Egypt, and Scandinavia. This could explain why the Pre-Roman Egyptians are visibly Asian people, and further, why Thai-style architecture exists in early Scandinavia. Though the latter might sound totally implausible, it is important to note that some Thai and Norwegian people are nearly identical on the maternal line, with about 99.6% of the genome matching. Something has to explain that. Also note that the Sri Lankan maternal line was present throughout Europe around 33,000 BC. This suggests plainly that many Europeans, and the Classical World itself, descend from the Phoenicians. That somewhat remote populations also descend from them is not too surprising, in this context.
Further, there are alarming similarities between the Nordic religions and alphabet, and the Canaanite religions and alphabet, in particular, the gods El / Adon and Odin, with their sons, Baal and Baldur, respectively. Once you place greater emphasis on genetic history, over written history, this story sounds perfectly believable. Further still, if people migrated back from South Asia to the West, then this should again not be limited to Scandinavia, and this is in fact the case. Astonishingly, the Pre-Roman Egyptians test as the descendants of the Thai people, using the same analysis. Obviously the Pre-Roman Egyptians were not the first Africans, and in fact, everything suggests they’re South Asian, and for the same reason, none of this implies that modern day Scandinavians are the first Scandinavians, and instead, again, it looks like many Norwegians and Finns are instead, again, South Asian.
Finally, this is all consistent with the obvious fact that the most advanced civilizations in the world, i.e., the Classical World, are all proximate to the Middle East, suggesting that the genesis of true human intelligence, could have come from somewhere near Phoenicia.
