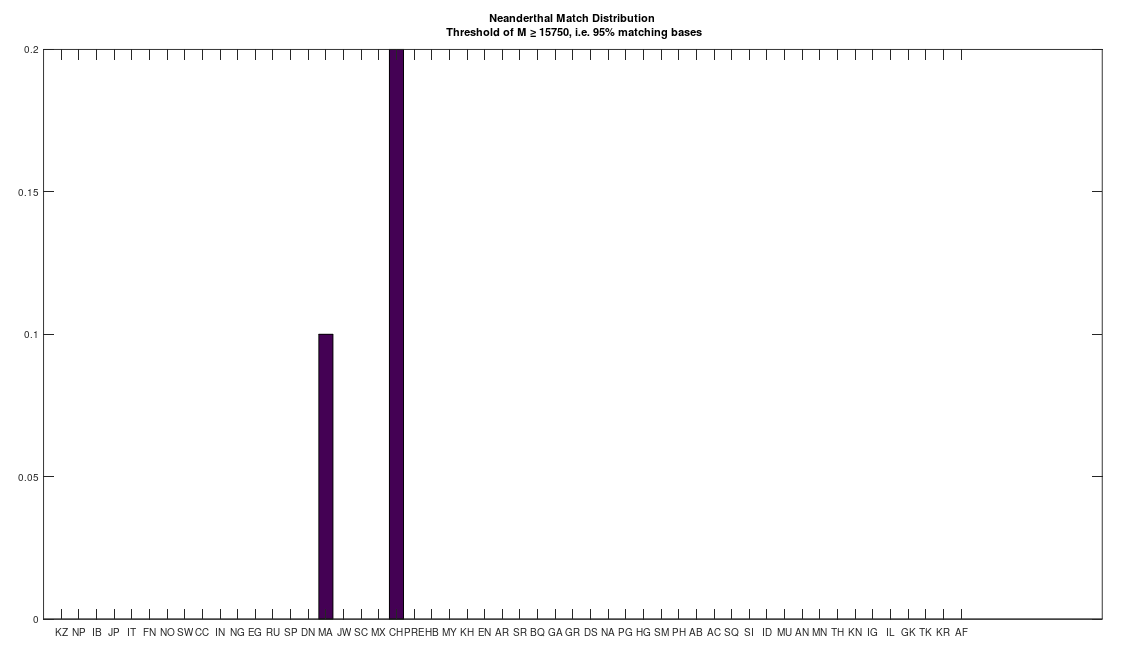
I initially lost interest in Neanderthal mtDNA, simply because I couldn’t find a meaningful match in any ancient or modern population. However, I just revisited the Neanderthal genome, out of curiosity, given that the dataset has now doubled in size since I started, and it turns out there are 95% matches to the Maritime Archaic and the Chachapoya. The Maritime Archaic match is already surprising, because they were in Canada. However the Maritime Archaic are from as early as 7,000 BC, so, it’s at least ancient. In contrast, the Chachapoya lived until 1470, and had contacts, and even mated with Europeans. The match percentage in both cases is significant, with 10% of the Maritime Archaic and 20% of the Chachapoya, 95% matches to the Neanderthal genome. This plainly implies that Neanderthals lived well into what is fairly modern history. This of course in turn suggests the possibility of living Neanderthals, since I doubt anyone would notice, given that at this point, they’d be basically indistinguishable from us due to intermixing.
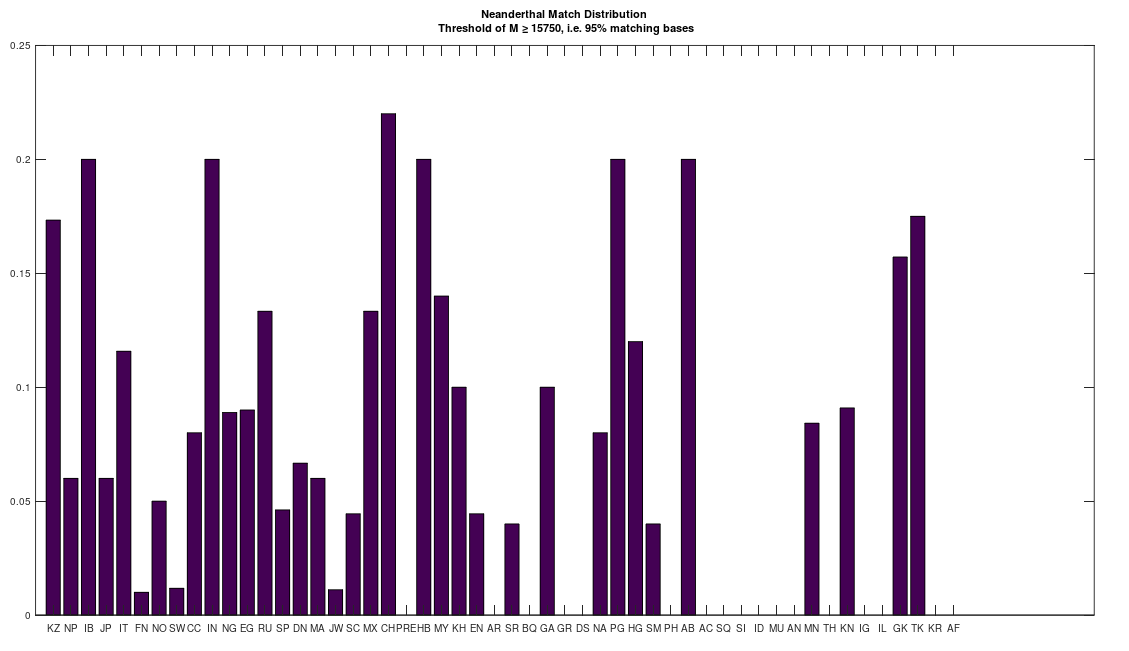
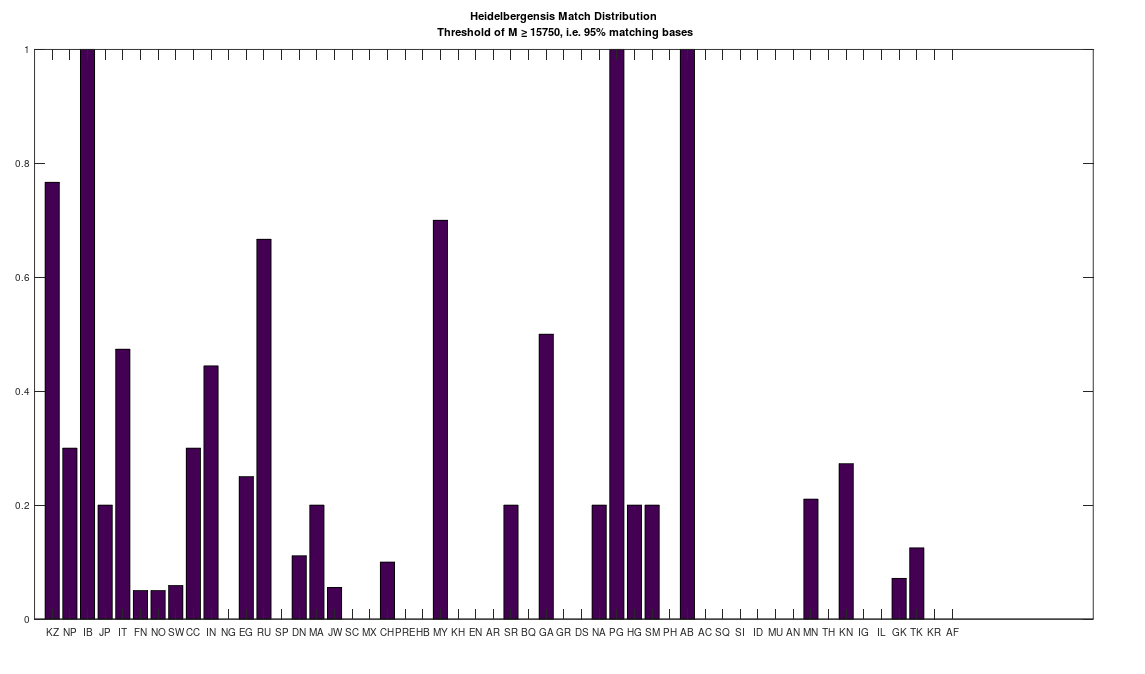
As a consequence, I decided to download a few more Neanderthal genomes, and there are a ton of them on the NIH Website. And as it turns out, there are plenty of people that are a 95% match to the Neanderthals (left), and these are the same populations that are a 95% match to Heidelbergensis (right), suggesting plainly a connection between Neanderthals and Heidelbergensis. If you’re interested, you can read my paper, A New Model of Computational Genomics for an explanation of the methods involved in producing these charts.
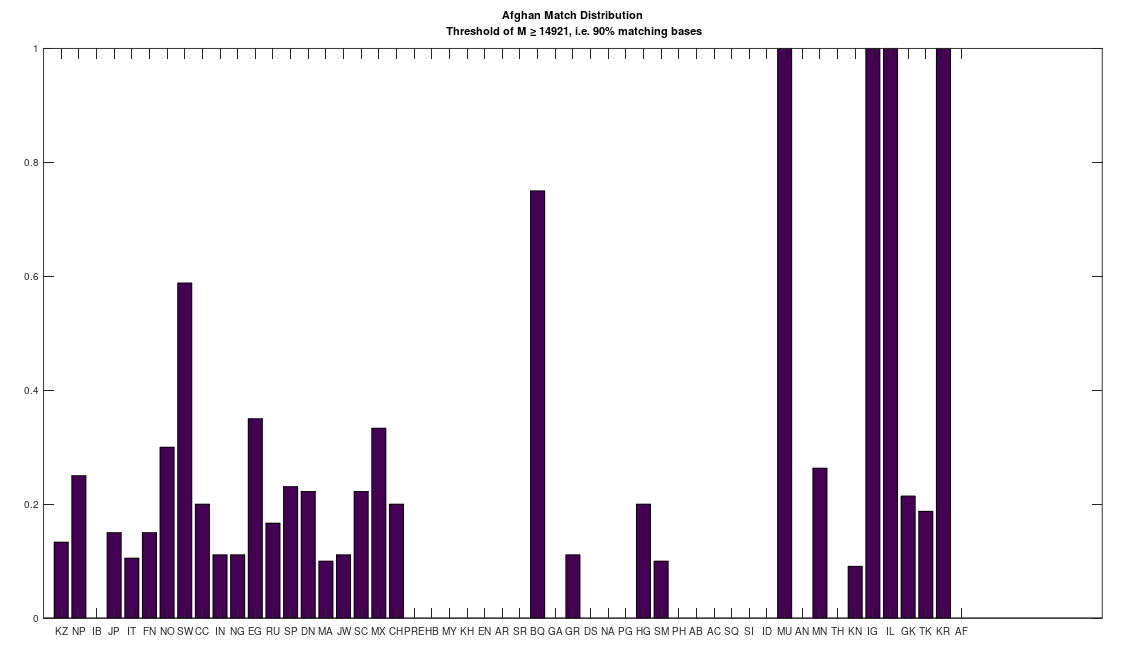
I’ve tested a few Pashtun mtDNA genomes, again taken from the NIH Website, and it’s obvious that they’re related to the Basque, and the Northern Europeans generally. This is not the case for Iranians, though the Iranians are also related to Europeans (just not as obviously related to the Northern Europeans). One sensible theory is that this is the result of the Bactrian Empire, which occupied much of present day Afghanistan. The match count for the chart below is set to 90% of the genome (i.e., a genome from a given population is treated as a match only if it is at least a 90% match to the Afghan genome). If you’re interested in the methods, see my paper, A New Model of Computational Genomics [1]. It is at this point obvious to me that someone is committing genocide against this group of people, which is a global population of people that seem to have historical ties to Asia, and includes many Jews, but not all Jews. The Jews are obviously split into two totally different people: one group is Northern European, and the other is definitely Denisovan. See [1] generally. The Jews are not unique in this regard, as 100% of the Iberian Roma and Papuans are a 95% match to Heidelbergensis. The obvious takeaway is that these ostensibly archaic species are alive today.
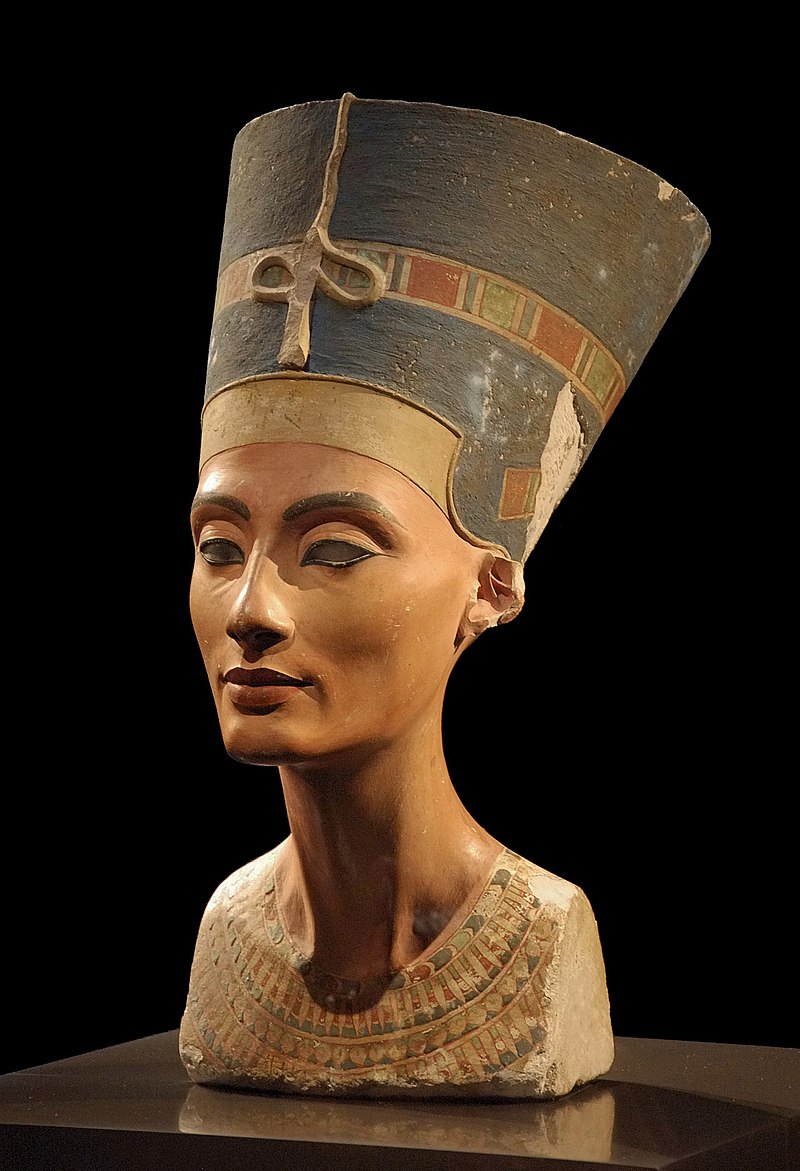
I’ve always had two Ancient Egyptian genomes in my dataset, though I was only interested in the older of the two, which is from about 4,000 years ago, primarily because this is prior to Rome, and also because of the obvious morphological differences between Egyptian Royalty before and after Rome. Specifically, prior to Rome, the Egyptians looked Asian, and are in fact genetically related to Asian people, whereas afterwards, they looked European. On the left is Menkaure and Queen Khamerernebty II (c. 2,530 BCE), courtesy of MFA Boston, in the center is Nefertiti (c. 1,370 BCE), courtesy of Wikipedia, and on the right is Cleopatra (c. 50 BC), courtesy of Wikipedia, who plainly looks nothing like the rest of them. Moreover, the aesthetic is also completely different, plainly closer to that of Rome and Greece, and I would wager that the skills that led to earlier Egyptian art were lost, together with the bloodline, which explains the change in the people themselves, and their art.
I just tested the newer of the two genomes, which is from around 120 AD, and there are significant differences. Below is a plot of the differences between the two populations, with the newer Egyptian genome distribution subtracted from the older Egyptian genome distribution, and so a positive number in a given column implies the population in question is closer to the older Egyptian genome than the newer Egyptian genome, and vice versa. The minimum match count is set to 70% of the total genome. There were 105 other genomes that matched to the older Egyptian genome, and 87 other genomes that matched to the newer Egyptian genome. There is apparently no overlap between the two genomes, and together, 192 people are related to one or the other. There are a total of 484 genomes in the dataset, and so rough justice says about 40% of the world’s current population is related to the Ancient Egyptians, though this is not precise, because there are a significant number of other ancient genomes in the dataset. The net point is, especially because there are only two genomes, a large number of people alive today are related to the Ancient Egyptians, all over the world, and you can see that below.
Because these are single genomes, and because mtDNA is so stable, even over thousands of years, you can’t be certain that the differences between the two genomes are the result of time. Specifically, it could just be that these are two different families that are both from Ancient Egypt, and that both bloodlines were extant throughout Ancient Egypt. If this is the case, then it’s just chance that caused them to appear in this particular order. Note that I’m not referring to the order of their actual discovery (i.e., the date someone dug them up), and instead, the point in time at which the actual people lived. That said, the older of the two genomes is plainly significantly closer to ancient civilizations, specifically the Phoenicians and the Saqqaq. They are also significantly closer to the Thai people, which is consistent with the obvious fact that the Ancient Egyptians were visibly Asian people, prior to Rome. The newer genome is instead closer to the Swedes, Igbo (of Nigeria), the Icelandic, and the Munda (of India), who are all closely related to each other. This is again consistent with a migration-back to Africa hypothesis, which I’m now convinced of. If you’re interested in a more detailed analysis of these issues, and the underlying software, see my paper, A New Model of Computational Genomics.
All that said, the net takeaway is that a large portion of the world’s current population seems to have been a part of a very large group of people that lived literally all over the world, in antiquity. This suggests unambiguously, that ethnically diverse, and almost certainly interracial people, have existed for thousands of years, possibly longer, and the Pre-Roman Egyptians are themselves obvious evidence of this. Yet again, given the fact most modern people are far too stupid and lazy to build pyramids, anatomically correct yet innovative sculptures, and navigate the world in a small boat, the obvious conclusion is that these people were just better than you, but that’s not so hard, is it?
I’ve put together some code that allows us to compare entire populations, and find their Nearest Neighbors. The theory underlying the results is that mtDNA can be used to predict ethnicity with about 80% accuracy. See, A New Model of Computational Genomics [1], generally. As a consequence, it must be the case that mtDNA carries information about the paternal line of an individual, otherwise it would be impossible to produce such high accuracies. Because mtDNA comparison implies surprising genetic relationships among superficially disparate people, there must be an explanation for it. As it turns out, the methods presented in [1], are perfectly consistent with a migration back to the West from Asia, which finds support in academic literature [2], and moreover, I’ve presented perfectly sensible, and independent mechanical theories that explain this as well. So e.g., how could it be that a Norwegian and a Nigerian share a significant portion of both maternal and paternal lineages? The answer is that both likely migrated back from Asia, about 70,000 years ago (see [2] generally), and moreover, that appearance is coded for by a very small portion of the total human genome (at least that’s my hypothesis).
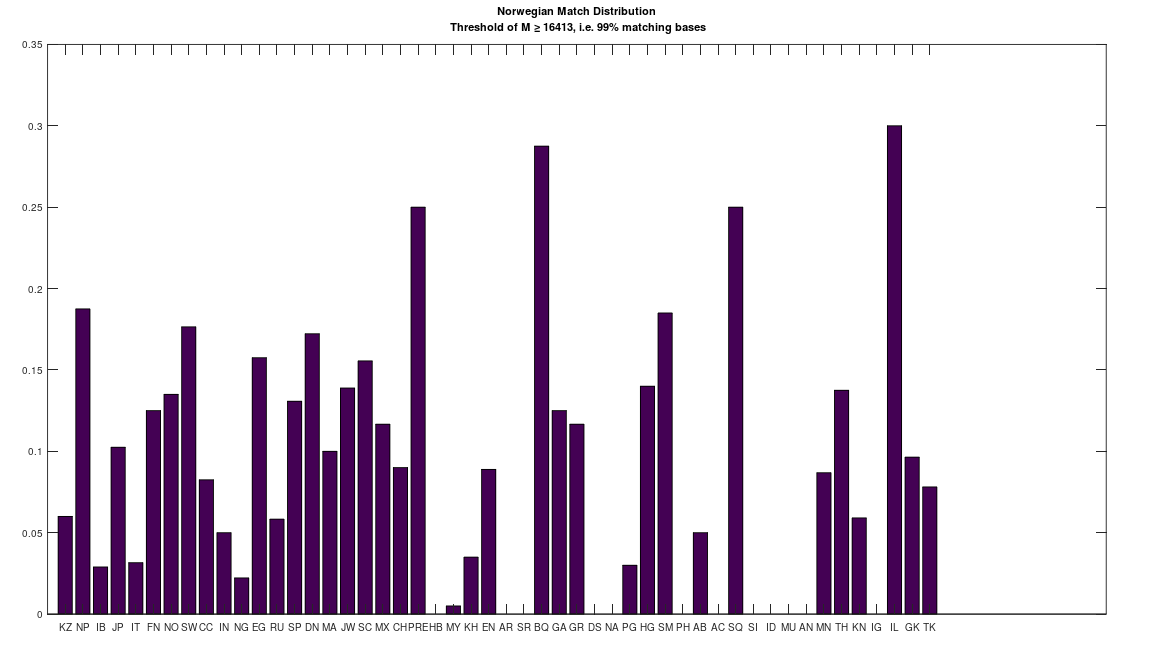
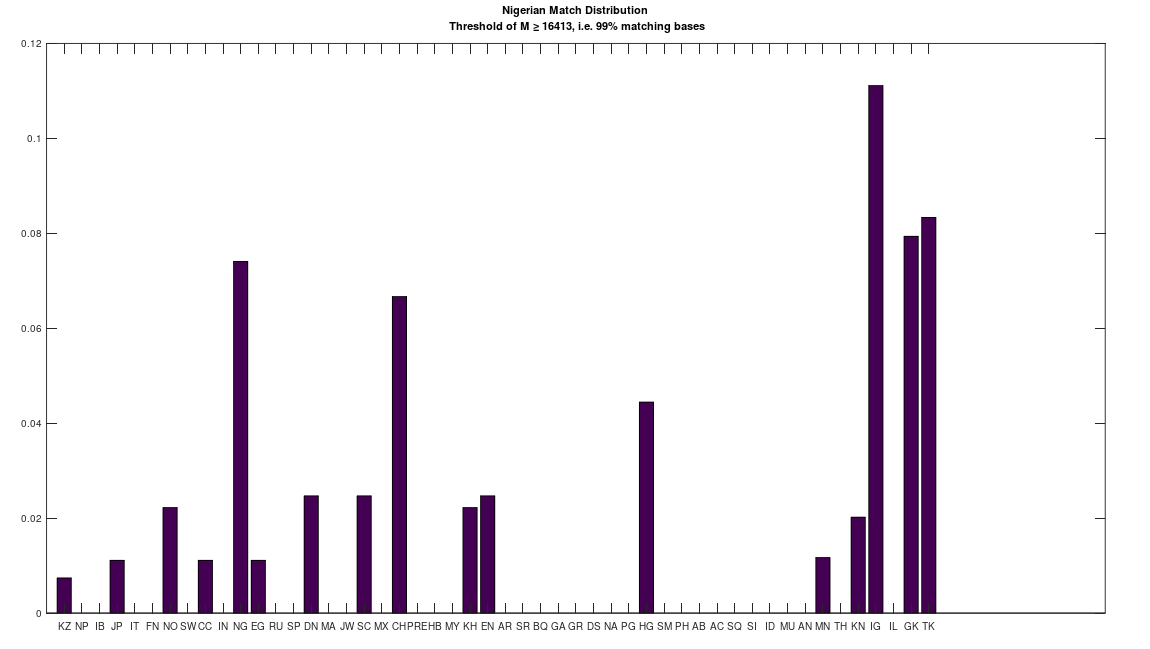
We can therefore, given two distribution of matches between two given populations, and many others, compare the two distributions For example, the chart below (on the left) shows the distribution of mtDNA genomes that are a 99% match to the Norwegian people. The y-axis shows the normalized maximum possible number of matches, and the x-axis shows the population name. The chart on the right shows the same for the Nigerian people. As you can plainly see, some Norwegians and Nigerians are a 99% match to the other, at least on the maternal line, as measured by mtDNA. And as noted, it must be the case that mtDNA carries information about paternal lineage as well, and therefore, we can also conclude, that these two individuals share a significant portion of their paternal lineages. There is simply no way around this, it must be the case, and assumptions to the contrary are the result of a culture that is limited in scope, simply because written human history is only a few thousand years old, whereas our actual history is at least several hundred thousand years old, and possibly millions of years old.
That said, the distributions are plainly different, and that is the purpose of this analysis, which is to take an entire population, and find the population that is most similar to it, as measured by their distributions. These results are less surprising, though some are still counter-intuitive. The table below shows the results of this analysis, which you can run for yourself using the attached code. The comparison between two populations is straightforward, you simply take the absolute value of the difference between two corresponding columns in the charts above. So for example, if we’re comparing Norwegians and Nigerians, we would take the height of column 1 in the left chart, and subtract it from the height of column 1 in the right chart, and take the absolute value of that difference. We then take the sum over all of the columns (i.e., their differences), and divide by 50, which is the maximum possible difference, since there are 50 populations in the dataset. This produces a measure of distance between the populations over [0,1], and below, you’ll find the Nearest Neighbor of each population (i.e., the other population with the minimum distance to the population in question). The results are sorted in order of increasing distance, and so the closest relationships are listed first. Note I’ve excluded any single-genome populations (e.g., the Ancient Egyptians), as well as the Denisovans, since the Denisovans are not a 99% match to any modern population, though they are a 70% match to many living populations.
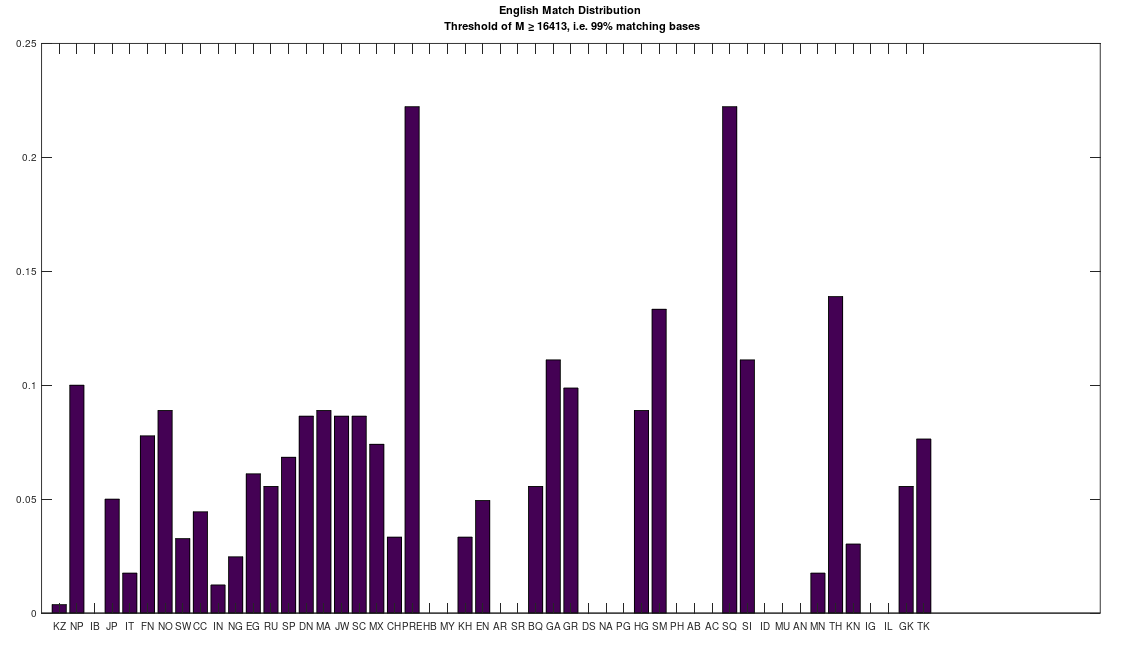
You’ll see the Iberian Roma and the Papuans are the closest match. This might seem surprising, given that they’re plainly morphologically distinct people. However, they are both nearly perfect matches for Heidelbergensis, and as a general matter, living populations that are related to Heidelbergensis, are all close matches to each other (i.e., 80% or more of the mtDNA genome is identical). You’ll also see some obvious results, like the Scotts and the Norwegians, the Turks and the Greeks (despite the animosity), and the Khoisan and the Nigerians. However, you’ll also see some surprising relationships, in particular, the connection between the Khoisan and the English. In particular, both the English and the Khoisan are closely related to the Pre-Roman Egyptians, and the Saqqaq people of Greenland. Isn’t life something when you really do the work?
Here’s the table, the code is below, together with the dataset.
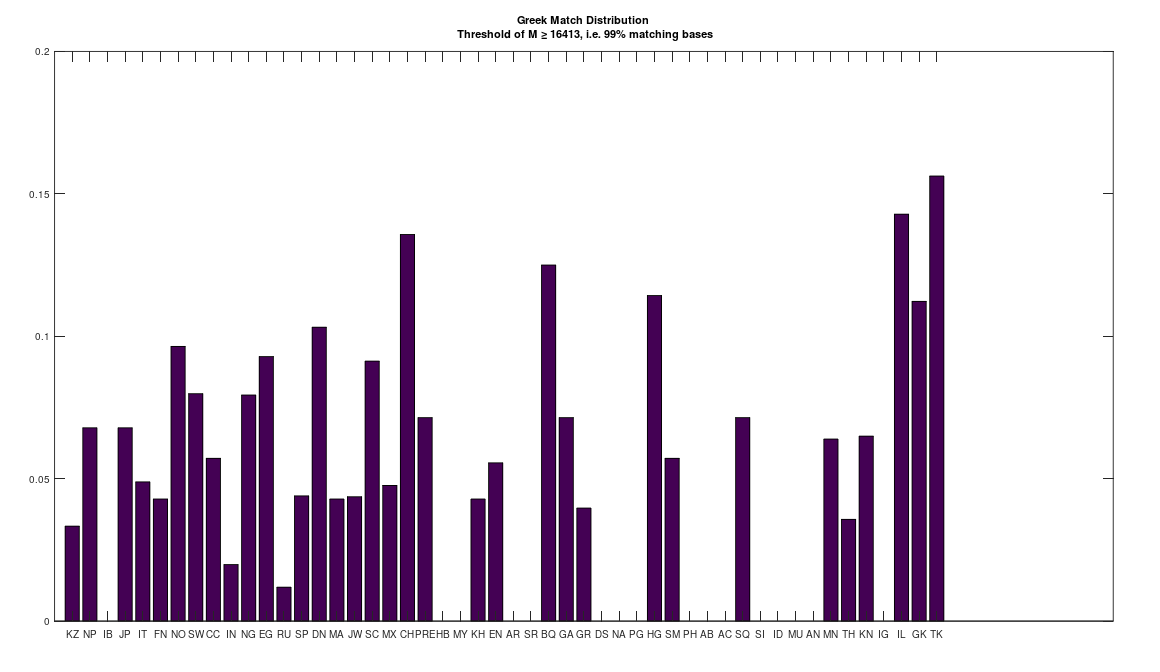
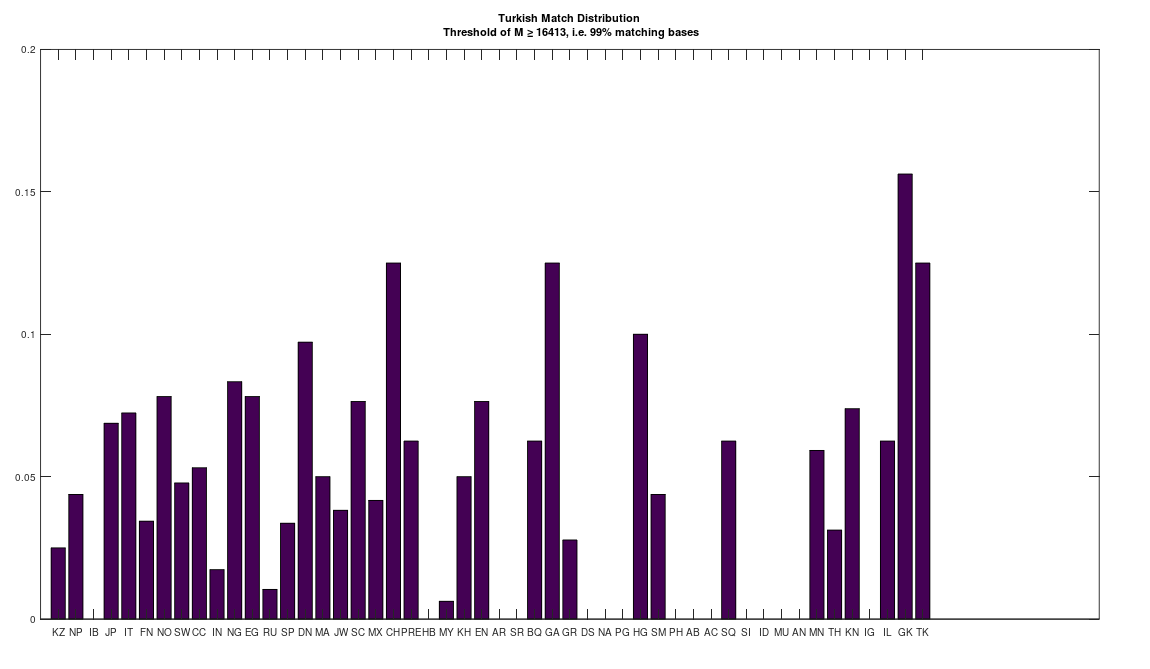
I’ve expanded my dataset of human mtDNA to include 14 Greek genomes, and 16 Turkish genomes. The results are interesting given the historical animosity, and violence, between Greeks and Turks, in that they are very similar people. In fact, the main reason I’m writing this note is because the Turks are closer to the Greeks genetically, then the Greeks are to themselves. That is, the match score between Greeks and other Greeks is lower than the match score between Greeks and Turks. Intuitively this sounds suspicious, but it actually makes perfect sense –
The Greeks are closer to the broader set of Europeans (and others) than they are to themselves, implying a heterogenous population of global people, including Turks. That is, the Greek population plainly includes a significant number of people that are basically identical to people that live in Turkey, and are ethnically Turkish, though they’ve likely forgotten this, and instead identify as Greek. Recall, all the genomes in my dataset are diligenced to ensure that the person in question is e.g., ethnically Chinese, as opposed to simply located in China. So in this case, all of the Turkish genomes are from people living in Turkey, that are identified as ethnically Turkish, and the same is true of the Greeks. Below you can find the distribution of 99% matches between the Greeks and everyone else (left), and the Turks and everyone else (right). As you can see, they’re similar populations. The population acronyms can be found at the end of my paper, A New Model of Computational Genomics (e.g., TK is Turkish).
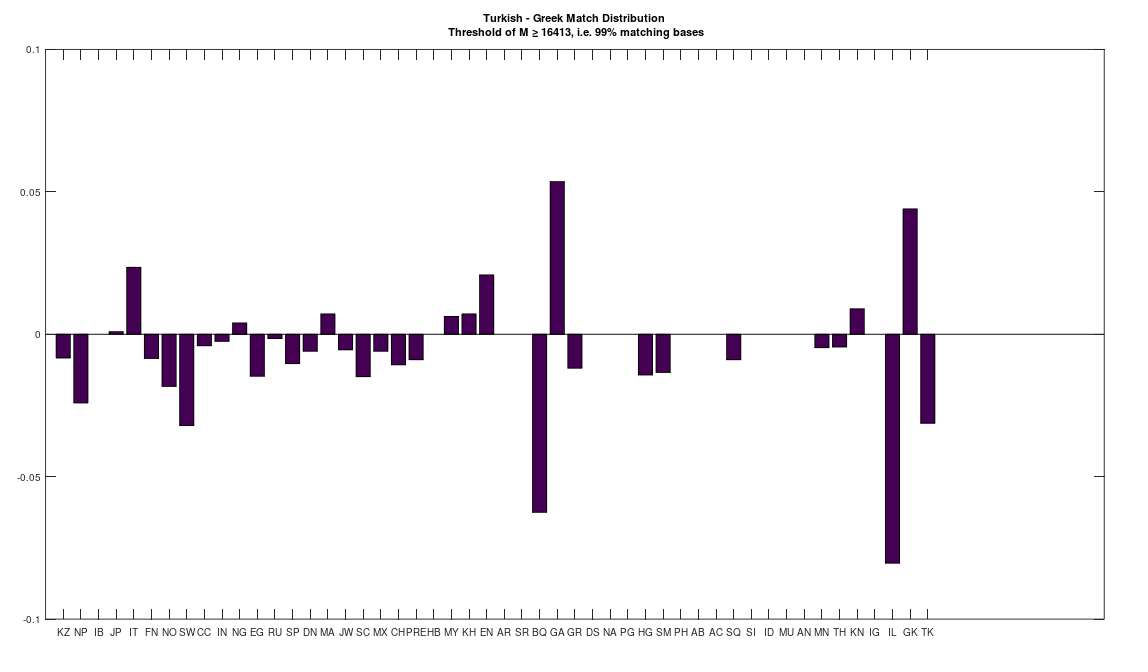
In order to refine the analysis, I produced a third chart (below) that shows the difference between the match scores for each population, to get a better sense of the difference between Greeks and Turks. All I did was literally subtract the Greek match score for a given ethnicity from the Turk score for that same ethnicity, causing the range (i.e., y-axis) to vary from -1 to 1, though as you can see the differences are extremely small, and are instead bounded by -0.1 and 0.1 (i.e., 10%). This tells us that the distribution of global blood lines in Greece and Turkey are very similar (i.e., within 10% of each other), and you can see my earlier point, that the Turks are more Greek than the Greeks, in that the match score between the Turks and the Greeks is higher than the match score between the Greeks and the Greeks. And again, this makes perfect sense, if a large number of people with Turkish ancestry live in Greece, and nonetheless identify as ethnically Greek, due likely to forgotten history, which is obviously possible.
That said, you can see there are differences, just going in order, in that the Turks are closer to the Italians and the English. Moreover, the Greeks are significantly closer to the Basque (a group closely related to Northern Europeans), and the Turks are significantly closer to the Georgians. Further, the Greeks are significantly closer to Icelandic people (and all the other Northern Europeans) than the Turks, and this is really strange when you consider the fact that the Turks were part of the Axis Powers, despite the fact that they’re plainly not as close to Northern Europeans as the Greeks. Yet somehow, the Greeks were occupied by the ostensibly racially pure Axis Powers, in particular the Italians, who are obviously closer to the Turks genetically. It seems like WWII does make sense, it’s just the complete opposite of the public narrative sold by the Axis Powers. As a general matter, Nazi ethnic ideology is obviously complete nonsense, and the Europeans are unquestionably heterogenous people, and the Northern Europeans in particular, are arguably the most heterogenous people on Earth, with a mix of African, Asian, and European ancestry.
Consistent with this revealing analysis, the Northern Europeans, in particular the Danes and Norwegians, were also sent to concentration camps, despite not being Jewish. And not to pump my own work, but I’ve already researched this history thoroughly, so you can read all about it in the Afterword to my book VeGa. Though the numbers interned might seem small (there are plenty of links to primary sources in VeGa), keep in mind these are extremely small countries, by population. This is also consistent with the persecution of the Basque people during WWII, who are closely related to the Northern Europeans. It sounds insane, superficially, but I think the purpose of WWII was the annihilation of a group of people that all appear to be related to Europeans, including of course the Jews. I think this continues to this day. Common sense asks, who the Hell would do that? I think the answer is the Catholic Church, an institution that ruled Europe with an iron fist for almost two-thousand years, only to have Martin Luther, Henry the Eighth, Napoleon, and ultimately the U.S. marginalize the Catholic Church to the point of near irrelevance. And the Church was obviously involved in the Nazi Party from day one, and moreover, is also obviously involved in extremely high-level organized crime. My hypothesis is that the Church was going broke, science was obviously taking over, leaving the obedience the Church sought after for uneducated, unproductive people, who don’t have the money to support their extravagant lifestyle. To put it bluntly, they never cared about religion, the Church was and is a political and economic institution, so when Catholicism stopped paying the bills, they turned to crime, and I’m not joking at all, read God’s Bankers.
Amazingly, I came up with a Nigerian character for VeGa, who’s best friends with a Swedish guy, and as it turns out, the world being what it is, the Igbo people of Nigeria are extremely closely related to some Swedes, and seem to have identical histories as well. The Igbo people were of course also subject to genocide, and might have been targeted by the Trans-Atlantic Slave Trade. This character was not intentionally created (i.e., I came up with the character long before my work in genetics), and it doesn’t mean that people should use science as an excuse to be scientifically racist, and only friends with people that have your genetic lineage, even though this would produce a remarkably diverse world. The point is instead that the world is so complex, that things that sound stupid and racist, are probably stupid and racist. That said, it’s pretty obvious someone has it out for a very specific group of people, that is superficially diverse, but all seem to come from Asia. Moreover, there’s some support for the claim that the Nazis were using rudimentary genetics to select people for extermination. This would allow them to discern among e.g., Jews and Gypsies, killing only some of them, and it is also consistent with the mysterious and awkward fact that Scandinavians, that were not Jewish, were sent to concentration camps in large numbers. Many Scandinavians are of Asian descent.
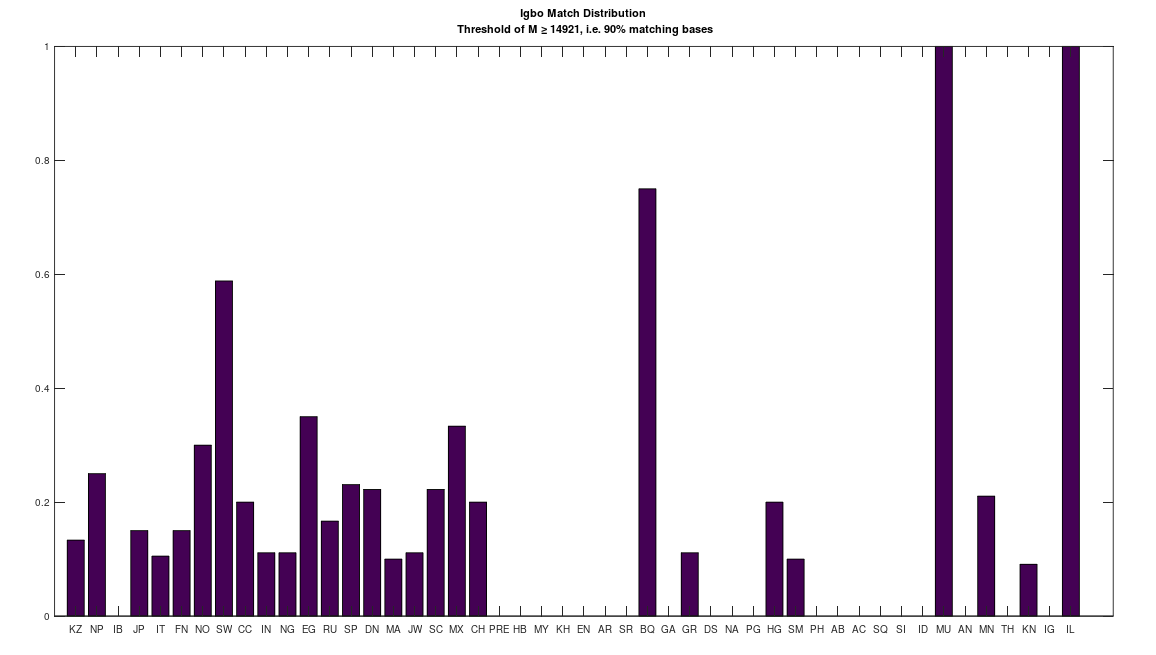
I found an Igbo genome on the NIH website, and I just never got around to writing about it, though it’s positively fascinating. The Igbo people are (to my knowledge) located primarily in Nigeria, and when I initially started my work in genetics, I noticed some astonishing finds in Nigerian people, with some basically perfect matches to Norwegians and Japanese people. At this point, I’ve made perfect sense of how these things are possible, and they’re not at all inconsistent with accepted theories, they have nothing to do with slavery, and in particular, there’s academic support for a very early migration back to Africa from Asia about 70,000 years ago. My hypothesis is that many Northern Europeans were part of that same original group of people in Asia.
The Igbo genome suggests exactly this, since it is a 98% match to an Icelandic genome, many Swedes, and some Norwegians, Finns, and Danes (see left chart above). Moreover, if you reduce the match threshold to 90% of the genome, you find the Igbo genome is a match to the Munda people of India (see right chart above). This is perfectly consistent with the hypothesis of a migration back to Africa from Asia, which is again, at least supported by some academic research. Specifically, in this case, it suggests that the Ibgo are from India. You can supplement this with a hypothesis that the same original group of people from India separated, with some of them going to Scandinavia, and others going to Africa. Keep in mind, Iceland is far more insular than the rest of Scandinavia, so much so that Icelandic is a distinct language, that is close to Old Norse, a language from the Viking Age. And though I can’t find more than one Icelandic genome, common sense suggests the Icelandic people are extremely homogenous, and this is supported by the fact that inadvertent incest is a serious issue in Iceland. The point being that this is probably not a one-off, and moreover it can’t be, because the Igbo are plainly related to the Northern Europeans generally.
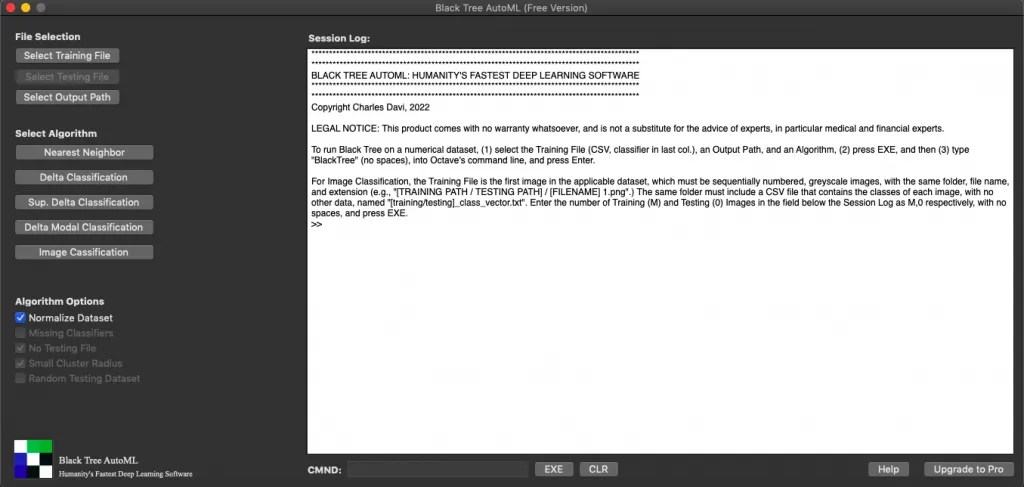
Black Tree brings the power of parallel computing, together with data compression, producing runtimes that are simply incomparable to other Deep Learning techniques. For a high-level academic summary of the underlying algorithms, see Vectorized Deep Learning. Download a Free Version of Black Tree from www.blacktreeautoml.com.
The results below were generated using Black Tree’s “Supervised Delta Classification” algorithm. This algorithm is included in the Free Version of Black Tree, so you can download the datasets below and see for yourself, that there is simply no contest between Black Tree and other Deep Learning techniques. All runtimes were generated on a MacBook Air 1.3 GHz.
Dataset
Classification Accuracy
Total Runtime (Pro)
Total Runtime (Massive)
UCI Credit 25,500 Training Rows 4,500 Testing Rows
83.33%
1,467 seconds
223.7 seconds
UCI Ionosphere 298 Training Rows 53 Testing Rows
94.11%
0.755 seconds
0.201 seconds
UCI Iris 127 Training Rows 23 Testing Rows
95.65%
0.237 seconds
0.086 seconds
UCI Parksinsons 165 Training Rows 30 Testing Rows
90.90%
0.379 seconds
0.083 seconds
UCI Sonar 176 Training Rows 32 Testing Rows
95.65%
0.513 seconds
0.108 seconds
UCI Wine 151 Training Rows 27 Testing Rows
96.70%
0.310 seconds
0.082 seconds
Image Classification
Black Tree’s image compression algorithms allow Image Classification tasks, including medical imaging classification, to be accomplished in roughly the same amount of time as Data Classification tasks, again producing simply unparalleled runtimes. Black Tree Pro and Black Tree Massive use the exact same image processing and classification algorithms. The Free Version of Black Tree includes the exact same algorithms, with a hard limit of 2,500 images. Accuracies and runtimes for the MNIST Numerical and MNIST Fashion Datasets are 99.95% and 286.09 seconds (5,000 Training Rows and 5,000 Testing Rows), and 92.85% and 15.90 seconds (1,000 Training Rows and 1,000 Testing Rows), respectively.
Black Tree Runs in a GUI
The front-end for Black Tree runs in an easy-to-use interface, reducing Deep Learning to a task that can be accomplished by an admin or assistant, thereby allowing for radical reductions to costs and headcount associated with Deep Learning. For the same reasons, Black Tree allows firms and individuals to spend a small sum of money (see pricing below) to test the question of whether investing in Deep Learning is worthwhile. For some users, this question can likely be answered by the Free Version of Black Tree.
Pricing
Download the Free Version of Black Tree, which includes (i) data classification and clustering, and (ii) image classification (grayscale only), up to exactly 2,500 rows / images (non-commercial license), or select from the commercial licenses below.
NOTICE: All sales are final, no refunds available. For technical support, see Contact Information.
A lifetime commercial license for one user, which includes (i) data classification and clustering, and (ii) image classification and clustering (grayscale only), up to around 25,000 rows.
A lifetime commercial license for one user, which includes (i) all of the algorithms included in Black Tree Pro, (ii) a significantly faster Supervised Delta Classification algorithm, (iii) a significantly faster normalization algorithm, together with (iv) Massive Algorithms that can classify 500,000 rows in approximately ten minutes, and (v) confidence metrics that allow for precise classification.
Black Tree Osmium (Coming Soon)
A lifetime commercial license for one user, which includes (i) preprocessing, compression, analysis, and anomaly detection algorithms that can be applied to data, image, video, and 3D and higher dimensional data and video (i.e., high-dimensional time-series), (ii) image and video classification algorithms, (iii) 3D object detection, tracking, and classification algorithms, (iv) high-dimensional time-series prediction and interpolation, (v) algorithms that can detect periodicity and stable average values in time-series data, and (vi) N-dimensional optimization.
I noted in my paper, A New Model of Computational Genomics [1], that many living human beings are very closely related to both Denisovans and Heidelbergensis. This likely doesn’t come across in standard genome comparison, because it seems current standard methods make use of local alignments, that effectively ignore insertions and deletions. This causes basically all living people to seem roughly similarly related to archaic humans. If you instead don’t use local alignment, you see drastic differences in match counts, with only some modern humans closely related to Heidelbergensis and Denisovans. First off, insertions and deletions are obviously very significant, since they produce diseases like Downs Syndrome and Williams Syndrome. Secondly, my methods are plainly more precise than using haplogroups (see [1] generally), and I use a single global alignment method. The net conclusion being, that local alignment produces imprecision because it ignores insertions and deletions, which are obviously significant. For example, run a BLAST search on this genome, and you’ll see “gaps” in the reports, which plainly artificially inflate the match percentage. In contrast, my work is able to predict ethnicity with roughly 80% accuracy, even between e.g., Swedes and Norwegians. This is simply not possible using local alignments, because everyone will end up a nearly perfect match to everyone else, which is obviously not true.
I’ve since updated the human mtDNA dataset that is the subject of [1], to include another 7 Denisovan genomes, and a population of 11 modern Kenyan genomes, as well as others. The dataset now contains a total of 452 complete human mtDNA genomes, over 47 global populations, including many ancient, and archaic humans. All genomes come from the NIH, and the dataset includes a provenance file with links to the NIH Database for each genome. All genomes have been diligenced to ensure that the person in question is e.g., ethnically Chinese, as opposed to someone simply located in China. See Section 1.4 of [1].
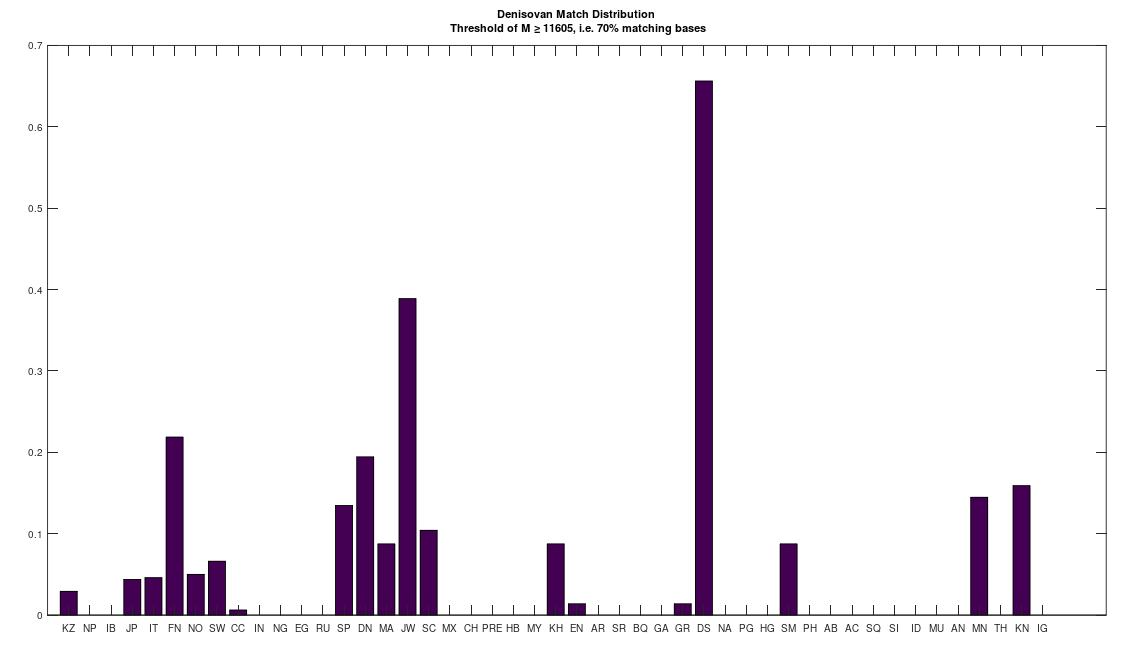
When running the same analysis I’ve always run, comparing the Denisovan population to the entire dataset, I found many Kenyans were a match. See the chart below, and see the end of [1] for a table with acronym names (e.g., KN is Kenyan). This is quite significant, since Southern Denisovan fossils have yet to be found, and if all hominins come from Africa, then there should be evidence of Denisovans in Africa. Unlike some of the surprising genetic relationships I’ve found, this could unfortunately be explained by slavery, for the simple reason that many Europeans are also matches to Denisovans. If Europeans related to Denisovans enslaved Kenyans, they could have reproduced with those Kenyans, which would have altered the maternal lineage of Kenyan people generally.
However, my work also allows us to determine whether a given genome A is the ancestor of another pair of genomes B and C. If modern day Kenyans are the genetic ancestors of the ancient Denisovan genomes collected in Asia, then this would eliminate slavery as a possibility, at least with respect to those ancestor genomes, and instead provide evidence for the claim that the Denisovans originated in Africa, and that at least some modern day Africans are the ancestors of the Denisovan fossils found in Asia. This is apparently the case, and moreover, the same is true of other Kenyans, with respect to Heidelbergensis. That is, some modern day Kenyans appear to be the ancestors of Denisovans, and others the ancestors of Heidelbergensis. The net conclusion is that all hominins could have come from Africa, and you can read this article for an explanation as to how this could happen, mechanically. This is obviously consistent with the popular narrative, but these things are not obvious, and there is both doubt and multiplicity in the academic community, though no one seems to think we come from America, so that point seems settled.
For an intuition as to how the ancestry test works, posit 3 genomes A, B, and C. Now assume B and C have more in common than A and B. A cannot be the ancestor of B and C, since that would imply that B and C both started out basically identical to A (since A is the ancestor of both B and C), and then both B and C randomly mutated to have more in common with each other than they do with A. This is basically impossible as a matter of probability, since it’s analogous to two people flipping independent coins ten thousand times, and ending up with nearly the same sequence of heads and tails. This is obviously wrong, but for a fulsome discussion, see Section 6.1 of [1].
The attached code applies exactly this test to two populations, treating one as ancestor (A), one as a descendent (B), and then attempts to find a genome C for which AB > BC and AC > BC, where AB, BC, and AC, are the match counts between genomes A, B, and C, respectively. If this inequality is satisfied, then it is at least possible for genome A to be the ancestor of genomes B and C. As noted, 2 Kenyan genomes out of 11 satisfy this test for the ancient Denisovan genomes, all of which were collected from ancient sites in Asia. Further, this inequality is also satisfied for 3 Kenyan genomes for the single Heidelbergensis genome included in the dataset. This seems to be unique to Kenyans, suggesting some Kenyans are truly ancient people. Specifically, 0 out of the 9 Nigerian genomes satisfied either test, and only 1 Khoisan genome out of the 10 Khoisan genomes satisfied the test for Denisovan, and only 1 Khoisan genome (a different genome) satisfied the test for Heidelbergensis. Note that the Khoisan are believed to be ancient people themselves. Further, 0 Egyptian genomes satisfied the test for Denisovan, however 5 Egyptian genomes satisfied the test for Heidelbergensis. The net point is again, all hominins seem to come from Africa, and a significant percentage of Kenyans (about 45%) seem to be truly ancient people.
I’ve also attached some extra code, that allows you to find descendent populations from a given population. You’ll note that all of you have committed atrocities against your own ancestors, I’m guessing because intelligence is not yet too common in the overall human population.
Posit a language over a set of characters capable of expressing any mathematical proof. Now consider the set of all strings that can be generated by taking any characters from . For example, , where each would be such a string in . The cardinality of is given by . Now consider the portion of comprised of strings that express a true theorem of mathematics. It is of course going to be extremely small, compared to the total cardinality of , which grows exponentially as a function of .
In my paper, Information, Knowledge, and Uncertainty [1], I showed both as a matter of theory, and empiricism, that the knowledge conveyed by an observation is given by,
,
where is the information content of the observation, and is the uncertainty of that observation. The information content of an observation is simply the logarithm of the number of states the observation could have taken on. See [1] generally.
Posit a theorem , and further assume that its shortest proof is of length , and that it is unique (i.e. there is no other proof of length ). It follows that the information content is in this case . The uncertainty is given by , because the state space of the problem is reduced to one possibility (i.e., the proof and theorem sought after). See Section 2 of [1]. It follows that the knowledge conveyed by is . Therefore, the knowledge conveyed by a theorem is a linear function of the length of its shortest proof.
Now you could of course argue that the calculation of is unduly generous, because mathematicians don’t churn through all possible strings. As a consequence, perhaps a more fair measure would be the number of valid statements of length . However, this is intuitively still exponential as a function of , though it is an interesting combinatorial problem. Nonetheless, the point being, that a standard page contains roughly 2,000 characters, implying an enormous amount of information is conveyed by theorems. This is contrast to the amount of information conveyed through observation, which is discussed at length in [1], and is plainly not as useful, because in order to produce an amount of knowledge equivalent to a 1 page proof, you would have to produce roughly 2,000 observations. No human being can consciously store 2,000 observations in their memory. In contrast, you can study, understand, and memorize a proof. This implies that mathematical knowledge allows human beings to maximize their measurable knowledge, whereas observation plainly has a low threshold, since you simply can’t keep too much information in memory.
The plain takeaway is that mathematicians produce knowledge that is plainly more useful than the information produced by ordinary people, and this is obviously the case anyway.
I have a ton of unpublished work on NLP, for the simple reason that I found absolutely no opportunities to make money from it, despite the fact I think it’s correct, though untested. However, it just dawned on me, that for the as of yet unfinished version of Black Tree, Osmium, which will include basically my full A.I. library, a GUI will probably be unmanageable, for the simple reason that my library is enormous – you can’t have a button for everything. As a consequence, it would probably be more efficient to simply type what you want Black Tree to do, using English. This is non-trivial, but I’ve already done enough work on NLP to make it happen. As such, I thought it worthwhile to at least introduce the basic concepts.
Specifically, every sentence has a subject, verb, and possibly an object. The subject, verb, and object, could all be qualified by other words, specifically, adjectives, adverbs, and quantities (e.g., some, all, one, the, etc.). This sounds trivial and obvious, but now you have an obvious algorithm for parsing a sentence – i.e., look for the verb, then look for the subject, and then look for the object (if it exists). Then look for their respective qualifiers (if they exist). This will cause every sentence (ignoring multiple independent clauses for now) to be reduced to a structure that contains three things, each of which could be associated with qualifiers. You can then compare a given sentence to a dataset of sentences, all stored in that format, which will give you meaning, if you simply return the set of sufficiently similar sentences. You can also give mechanical meaning to a sentence, which is my goal, by comparing a given sentence to a dataset of sentences that are associated with code.
First you load the sentence into a matrix, where each row contains a word, and compare every row to your dictionary, which contains articles of speech, thereby finding the verb. As a consequence, finding the verb in a sentence can be done in constant time, in parallel. Then once you find the verb, you search for its associated object, which must be a noun. You’re looking for all the nouns in the sentence, which again requires looking up each word in the sentence in a dictionary, to obtain its categorization as an article of speech. If you have an existing NLP dataset, you should be able to produce a best answer among all nouns in the sentence, for a given verb. For example, if the sentence is, “The drunk man ran to the dingy bar.”, then “man” is almost certainly going to be more frequently associated as a subject with “ran” as a verb, than “bar” and “drunk” (which can be a noun).
You can already see that it should be easy to produce a score for every noun in a dataset for every verb, which will allow you to quickly produce a best answer, if you calculate the scores beforehand. If the score’s already calculated beforehand, and stored (this will obviously be a big dataset), then it’s a constant runtime operation. In the worst-case, you have to calculate the score for all noun-verb combinations in a new sentence, for a given verb. This can be done by finding all (or at least some) instances of that noun-verb combination in the dataset, and calculating the percentage where the noun is the subject for the relevant verb (as opposed to the object). If the dataset is stored as a collection of matrixes (i.e., each sentence in the dataset is a matrix, with one word per row), then this can be done in two steps for each noun, in parallel (i.e., find the sentences that contain both the noun and verb in question). Then you apply the exact same process, except this time looking for an object, which will obviously return “bar”, rather than “drunk”. If you have independent clauses, then you find all the verbs separately, and apply an analogous process that will still work, because you’re finding the best pairs of subject / object and verb, you’re just doing it over a longer sentence that contains multiple verbs. In all cases, you have a constant runtime search for parsing a single sentence for meaning, and the total runtime will be a multiple of that constant runtime, given by the number of subject-verb, object-verb combinations, which should be low for any reasonable sentence, especially if it’s in a business context (i.e., an instruction or query).
Ultimately, what I’m planning to do, is have ML code be generated by NLP instructions, using already written ML snippets that are modified by the user’s instructions. This is literally what the GUI for Black Tree does, which is generate tailored ML code, using template code, as modified by the user’s selections. I would in this case be substituting the GUI with a set of instructions taken from an English sentence. This is not trivial, but it’s not that hard, at least using this methodology.





 capable of expressing any mathematical proof. Now consider the set of all strings
  that can be generated by taking any
  characters from
  , where each
  would be such a string in
  . Now consider the portion of
  ,
, is the information content of the observation, and
  is the uncertainty of that observation. The information content of an observation is simply the logarithm of the number of states the observation could have taken on. See [1] generally.
 , and further assume that its shortest proof is of length
  . The uncertainty is given by
  , because the state space of the problem is reduced to one possibility (i.e., the proof and theorem sought after). See Section 2 of [1]. It follows that the knowledge conveyed by
