In a previous note, I presented an algorithm that allows you to test ancestry flows between three populations. The method in the previous note already allows for bilateral comparisons, between the three populations. However, if you repeatedly apply the trilateral test, using all possible triplets from a dataset of populations, you will produce a graph. This graph will have bilateral flows using information derived from the entire dataset, as opposed to just three populations.
I’m still mulling through the data, but in the previous note, I stated that Norway seems to be the root population for basically everyone. I now think it’s somewhere around Holland and Denmark, using the full graph produced by the algorithm below. This is not to undermine the hypothesis that human life began in Africa, instead, the hypothesis is that modern homosapiens seem to have emerged pretty recently, in Northern Europe. All of this stuff needs to be squared off with other known results, in particular archeological results, but it does explain how, e.g., South East Asians have the gene for light skin, by descendancy (i.e., they’re the ancestors of white Europeans). I’m merely expanding the claim, pointing out that a lot of Africans also test as the descendants of Europeans, using mtDNA.
Here’s the code, more to come. You just call it from the command line saying “graph_matrix = generate_full_ancestry_graph(dataset, num_classes, N);”. The resultant graph flows are stored in graph_matrix. You’ll need the rest of the code, which is included in the paper I link to in the previous note.
In my paper, “A New Model of Computational Genomics” [1], I introduced an algorithm that allows you to test whether genome A is the ancestor of genomes B and C. You can read [1] to understand how it works, but for intuition, if both B and C begin identical to A, and then evolve independently in different environments, the number of bases they have in common going forward has to be the result of chance. Therefore, the genomes A and B, and A and C, should have more bases in common than B and C (i.e., both B and C deviate away from A independently of each other).
If we apply this test to three populations of genomes, instead of a single genome, we can count how many times the population A satisfied the inequality above, over all combinations of genomes selected from populations A, B, and C. Every time it is satisfied, we increment a counter associated with population A. We can then treat B and C as the ancestor (of course separately), again counting how many times the inequality is satisfied, producing a total of three counters. This will allow us to compare A, B, and C, and select the population that produced the greatest number of satisfied tests as the most likely to be the ancestor of the three populations. This is exactly what I did yesterday.
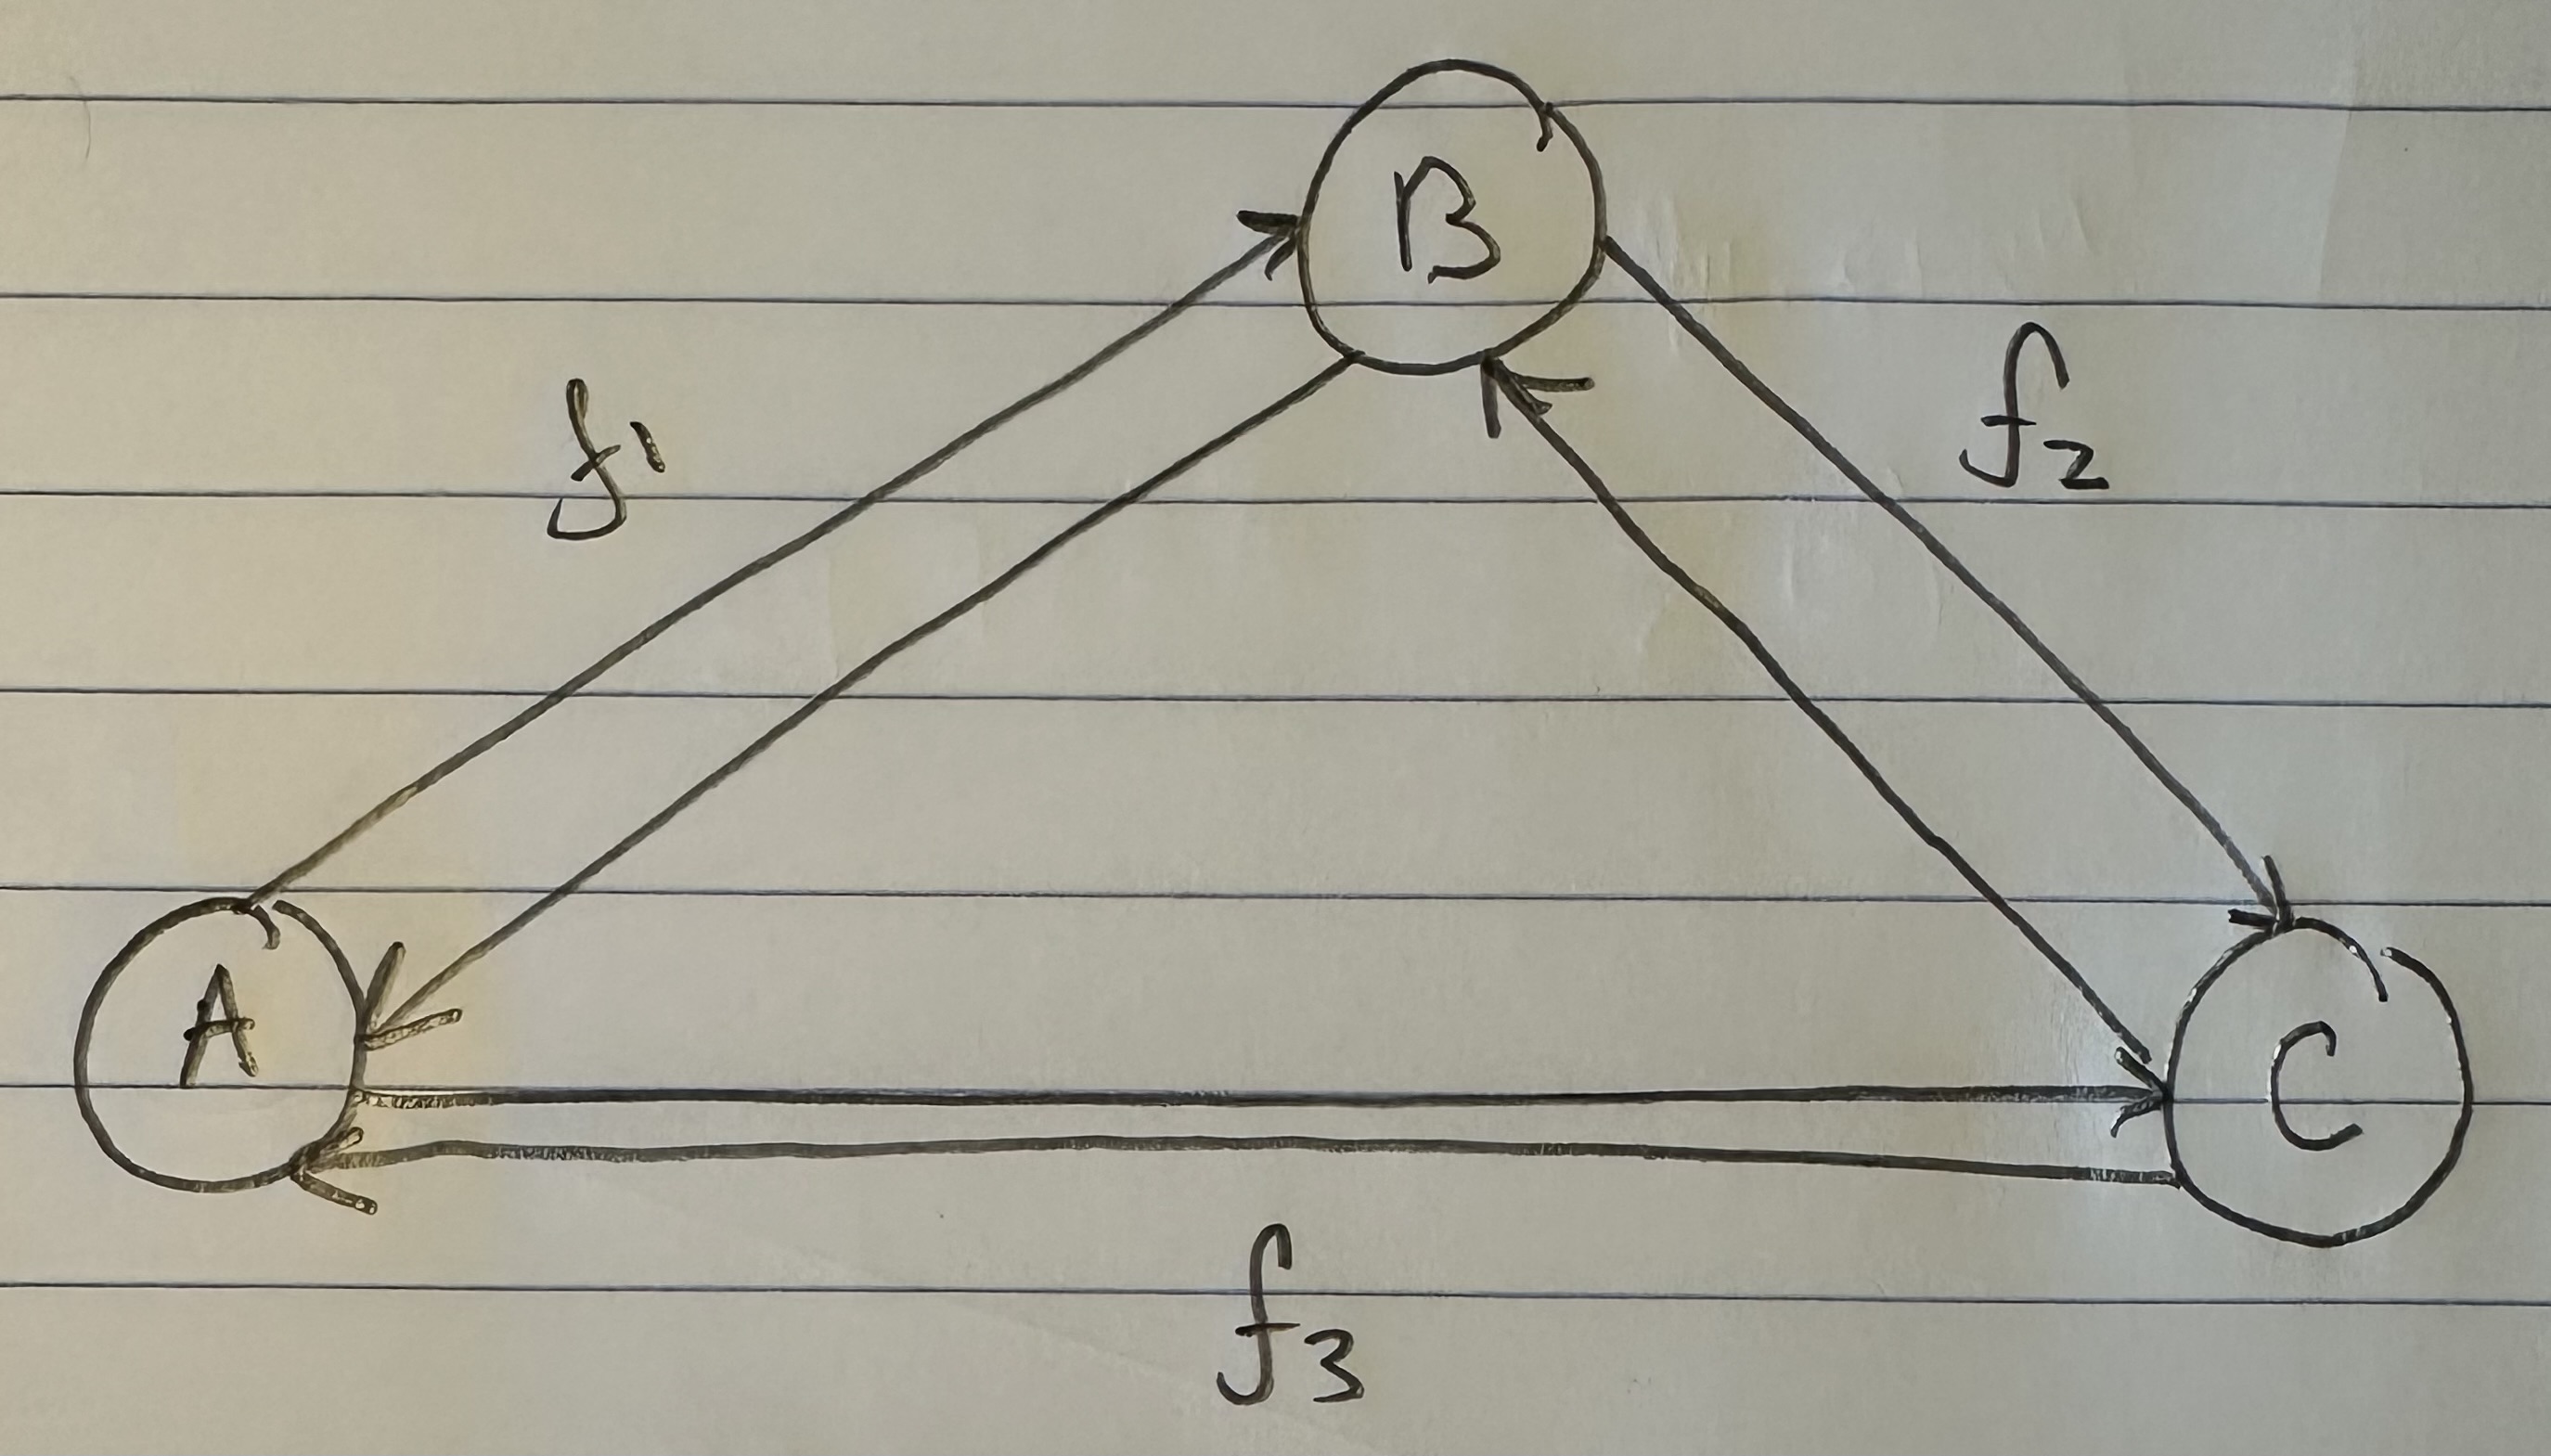
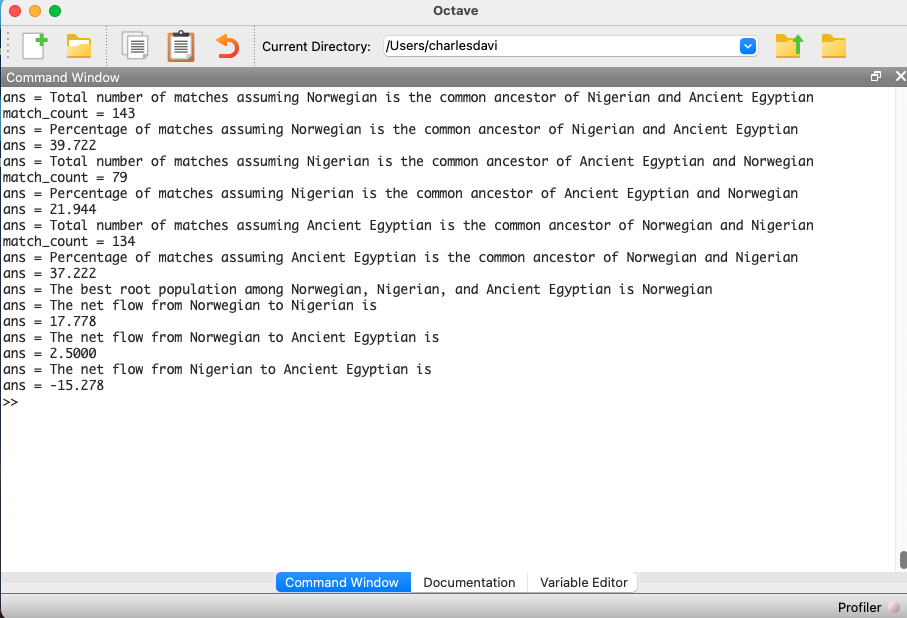
Each of the populations will again be associated with a counter that tells you how many times the inequality above is satisfied. If we divide by the total number of comparisons (i.e., the number of times we tested the inequality), we can produce a percentage. If e.g., we assume that Norway is the ancestor of Nigeria and Ancient Egypt, it turns out that test is satisfied 39.722% of the time. We can represent this as a graph with three vertices, one for each population, and a labelled edge running from the purported ancestor population to the two dependent populations. This is crudely represented below in my diagram, with an edge from Norway to both Nigeria and Ancient Egypt, labelled with the percentage of successful ancestry tests.
If we run the same tests again, this time treating each of Nigeria and Ancient Egypt as the ancestor population, we will produce an additional four edges, together producing a complete di-graph on three vertices in the form below. I nixed the labels for clarity, but did however include a new label “f”, representing the net percentage, and therefore net flow between the populations. This is easy to calculate, you just take the difference between e.g., the edge connecting A to B, and the edge connecting B to A, producing a single net figure from A to B. If the figure is positive, it means that A is more likely to be the ancestor of B, and if negative, that B is more likely to be the ancestor of A.
Below is some code that calculates the net flows for three populations, but I haven’t written any graph software yet (hence the “artwork” above). Astonishingly, Norway seems to be the root population for Nigeria and Ancient Egyptian. Now, this is subject to falsification, and there could be some other triplet of genomes that implies otherwise. That said, preliminary testing so far suggests that Northern Europeans, in particular Norwegians and Swedes, really might be the source population for a simply enormous number of people. And again, this could explain why South East Asians are literally white, genetically, which makes no sense, because it’s an extremely hot climate.
Interpreting the output below, we see that, in the context of the three populations, Norway is the best-fit ancestor of the Nigerians and Ancient Egyptians, and the Nigerians fit as a descendant of the Ancient Egyptians. What’s amazing about this, is you can use mtDNA, and literally impute geographic, directional flow, in this case, pointing mostly south, from Norway to West Africa and North East Africa. Thinking through all of this, it’s astonishing, because it’s just mtDNA, but you can literally project this onto a map, and determine geographic flows among populations.
This sounds crazy, Ancient Egyptians, they’re African! Sure, geographically, but when you look at their mtDNA, they appear to be South East Asian, and when you look at their artwork prior to Ancient Rome, they also look South East Asian. One sensible explanation, is that after the last Ice Age, about 10,000 years ago, populations that were otherwise stuck in Scandinavia started migrating. They don’t have to conquer to spread, they just have to survive with a higher probability than other populations. Given that they likely lived through Hell in a frozen tundra, once conditions improved, I think it’s perfectly sensible to assume that they survived with a higher probability than many other populations. This would cause them to spread without conquest, which seems to be the case, and I think what happened is, they ended up in South East Asia, migrating by foot (note Norwegians also test as the ancestor of Mongolians, Chinese, and Indian people, consistent with this hypothesis). Then, I think a group of South East Asians came back to the Middle East and North Africa (specifically the Pre-Roman Egyptians) by boat, which kicked off the ferocious competition of the Classical World. This is also consistent with the fact that the modern day Sri Lankans and Phoenicians are literally identical on the maternal line. This makes no sense, in the absence of interactions between the Classical World (or prior) and Asia. Also, there are obviously Asian Churches in Norway and several Buddha statues found at Viking sites. I don’t know for sure, because I’m only looking at mtDNA, but common sense suggests it’s something like this, otherwise you don’t have white people in a tropical climate like Thailand. I’ve been there, and I got horrible sunburn, it doesn’t make sense, absent an explanation like this.
Here’s the code, the dataset and any missing code can be found in [1].
In my paper, “A New Model of Computational Genomics” [1], I presented an algorithm that allows you to test for ancestry given three genomes A, B, and C. In short, if genomes B and C descend from genome A, then genomes A and B, and genomes A and C, should have more bases in common than genomes B and C. You can read [1] to see why, but it’s mathematically impossible for B and C to have anything meaningfully more than chance in common with each other, since they both start the same (i.e., identical to genome A), and then evolve independently.
In [1], I provide the code to implement this algorithm, but tonight I wrote a really fun algorithm that finds the best root population among entire populations A, B, and C. That is, it tests, genome by genome, whether a given combination of three genomes from populations A, B, and C (one from each population), satisfies the test stated above. By doing this repeatedly, it can report back the root population with the highest percentage of satisfied tests.
I’ve noted in the past (including in [1]) that it’s obvious the Northern Europeans are closely related to the Ancient Egyptians. Specifically, it looks like they descend from the Ancient Egyptians. More recently, I’ve noticed that a lot of people globally are related to Northern Europeans. Applying the algorithm I wrote tonight, it looks like the flow is from West to East, in that e.g., when you ask whether South Koreans are the ancestors of the Norwegians and Germans, you get a low metric. In contrast, when you ask whether the Norwegians are the ancestors of the South Koreans and Germans you get a significantly higher metric. This requires a lot more testing, but it could explain why e.g., South East Asians are literally white, in the genetic sense.
Overall, my view now is that human life began in Africa, at some point turning into Denisovans, which in turn produced Neanderthals, which in turn produced modern humans. Heidelbergensis also seems to flow from Denisovans, but Heidelbergensis does not seem to be the ancestor of modern humans. You can test all of this using the code below. Really interesting, the people of Cameroon are significantly Denisovan (and so are the Finns, Danes, and Jews). In some cases, the people of Cameroon test as the ancestors of Asian Denisovans found in a cave, dated to about 50,000 years ago. This suggests at least the possibility that the people of Cameroon are the real thing, our closest link to our original ancestors, that began in Africa, moved to Asia, moved back to Africa and Europe (in particular Ancient Egypt), and then spread all over the world, including back to Asia, and South East Asia in particular. I suppose by the time they made that last journey to South East Asia, they were already white. It’s a crazy story, and it’s simply incredible that mathematics allows you to deduce all of this from just mtDNA. Note that it’s an ordinal test only, so you can’t say how long these transitions took, but you can say that one genome is the ancestor of two others.
Here’s the code, enjoy! Any missing code (and the dataset) can be found in [1].