I’ve put together some code that allows us to compare entire populations, and find their Nearest Neighbors. The theory underlying the results is that mtDNA can be used to predict ethnicity with about 80% accuracy. See, A New Model of Computational Genomics [1], generally. As a consequence, it must be the case that mtDNA carries information about the paternal line of an individual, otherwise it would be impossible to produce such high accuracies. Because mtDNA comparison implies surprising genetic relationships among superficially disparate people, there must be an explanation for it. As it turns out, the methods presented in [1], are perfectly consistent with a migration back to the West from Asia, which finds support in academic literature [2], and moreover, I’ve presented perfectly sensible, and independent mechanical theories that explain this as well. So e.g., how could it be that a Norwegian and a Nigerian share a significant portion of both maternal and paternal lineages? The answer is that both likely migrated back from Asia, about 70,000 years ago (see [2] generally), and moreover, that appearance is coded for by a very small portion of the total human genome (at least that’s my hypothesis).
We can therefore, given two distribution of matches between two given populations, and many others, compare the two distributions For example, the chart below (on the left) shows the distribution of mtDNA genomes that are a 99% match to the Norwegian people. The y-axis shows the normalized maximum possible number of matches, and the x-axis shows the population name. The chart on the right shows the same for the Nigerian people. As you can plainly see, some Norwegians and Nigerians are a 99% match to the other, at least on the maternal line, as measured by mtDNA. And as noted, it must be the case that mtDNA carries information about paternal lineage as well, and therefore, we can also conclude, that these two individuals share a significant portion of their paternal lineages. There is simply no way around this, it must be the case, and assumptions to the contrary are the result of a culture that is limited in scope, simply because written human history is only a few thousand years old, whereas our actual history is at least several hundred thousand years old, and possibly millions of years old.
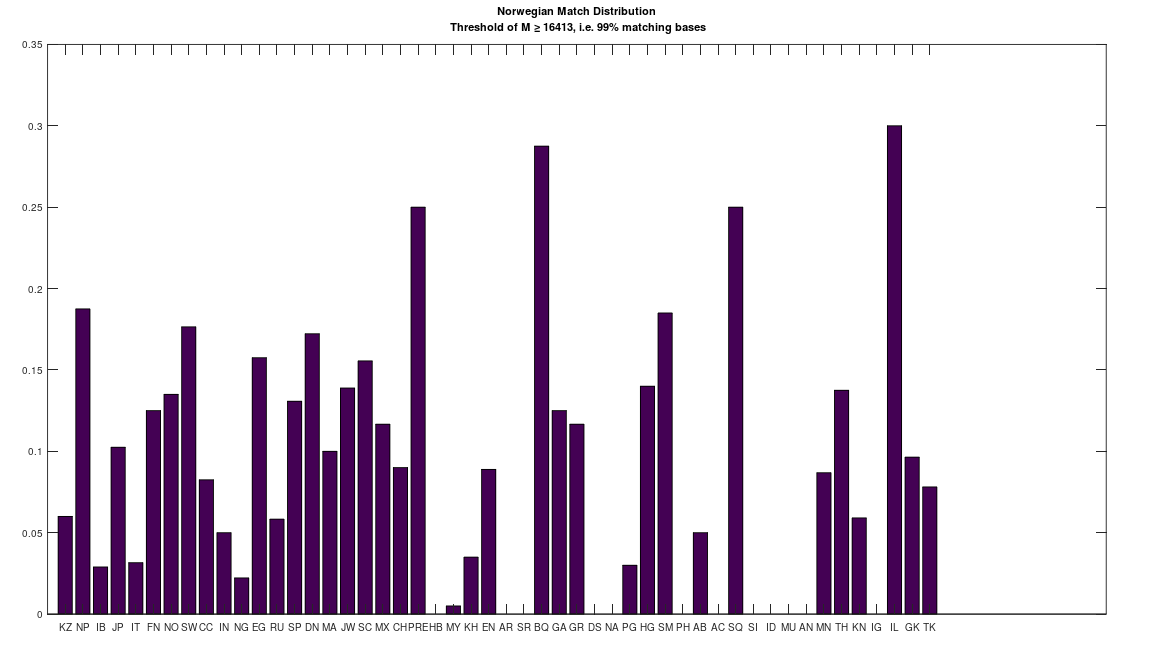
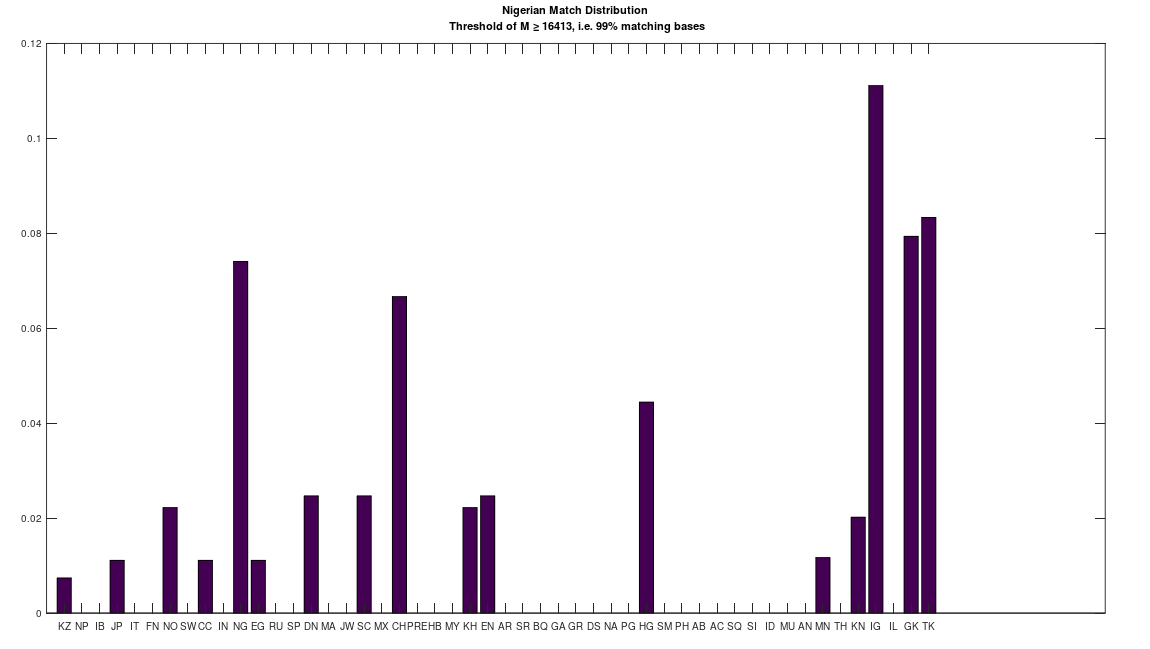
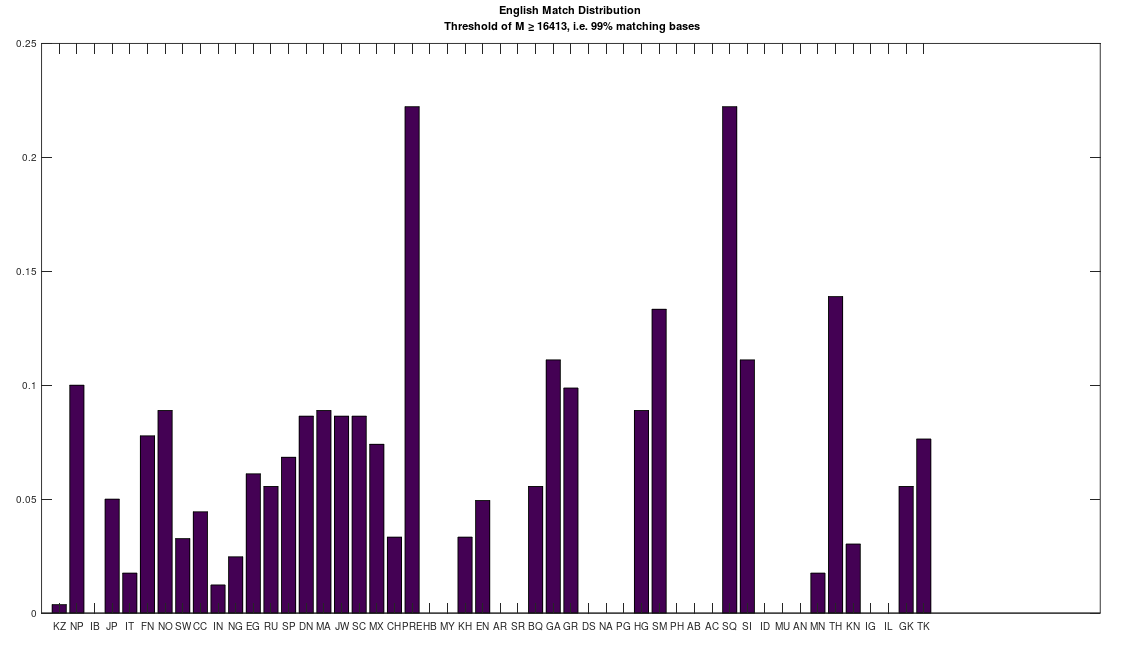
That said, the distributions are plainly different, and that is the purpose of this analysis, which is to take an entire population, and find the population that is most similar to it, as measured by their distributions. These results are less surprising, though some are still counter-intuitive. The table below shows the results of this analysis, which you can run for yourself using the attached code. The comparison between two populations is straightforward, you simply take the absolute value of the difference between two corresponding columns in the charts above. So for example, if we’re comparing Norwegians and Nigerians, we would take the height of column 1 in the left chart, and subtract it from the height of column 1 in the right chart, and take the absolute value of that difference. We then take the sum over all of the columns (i.e., their differences), and divide by 50, which is the maximum possible difference, since there are 50 populations in the dataset. This produces a measure of distance between the populations over [0,1], and below, you’ll find the Nearest Neighbor of each population (i.e., the other population with the minimum distance to the population in question). The results are sorted in order of increasing distance, and so the closest relationships are listed first. Note I’ve excluded any single-genome populations (e.g., the Ancient Egyptians), as well as the Denisovans, since the Denisovans are not a 99% match to any modern population, though they are a 70% match to many living populations.
You’ll see the Iberian Roma and the Papuans are the closest match. This might seem surprising, given that they’re plainly morphologically distinct people. However, they are both nearly perfect matches for Heidelbergensis, and as a general matter, living populations that are related to Heidelbergensis, are all close matches to each other (i.e., 80% or more of the mtDNA genome is identical). You’ll also see some obvious results, like the Scotts and the Norwegians, the Turks and the Greeks (despite the animosity), and the Khoisan and the Nigerians. However, you’ll also see some surprising relationships, in particular, the connection between the Khoisan and the English. In particular, both the English and the Khoisan are closely related to the Pre-Roman Egyptians, and the Saqqaq people of Greenland. Isn’t life something when you really do the work?

Here’s the table, the code is below, together with the dataset.
| Population Name | Matching Population Name | Distance [0,1] |
| Iberian Roma | Papua New Guinea | 0.0054314 |
| Papua New Guinea | Iberian Roma | 0.0054314 |
| Spanish | German | 0.0087907 |
| German | Spanish | 0.0087907 |
| Greek | Turkish | 0.011684 |
| Turkish | Greek | 0.011684 |
| Finnish | Spanish | 0.012359 |
| Norwegian | Scottish | 0.013209 |
| Scottish | Norwegian | 0.013209 |
| Egyptian | Norwegian | 0.013453 |
| Ashkenazi | Spanish | 0.015106 |
| Chinese | Kenyan | 0.016356 |
| Kenyan | Chinese | 0.016356 |
| Mongolian | Kenyan | 0.017578 |
| Nigerian | Khoisan | 0.019796 |
| Khoisan | Nigerian | 0.019796 |
| Danish | Scottish | 0.020229 |
| Maritime Archaic | German | 0.023826 |
| Thai | Maritime Archaic | 0.023944 |
| Chachapoya | Mongolian | 0.025063 |
| Italian | Turkish | 0.026546 |
| Japanese | Spanish | 0.027404 |
| Kazakh | Mayan | 0.028086 |
| Mayan | Kazakh | 0.028086 |
| Swedish | Norwegian | 0.028141 |
| Georgian | Thai | 0.029645 |
| English | Khoisan | 0.030645 |
| Russian | Kazakh | 0.034571 |
| Sardinian | Phoenician | 0.034652 |
| Phoenician | Sardinian | 0.034652 |
| Mexican | Greek | 0.034762 |
| Nepalese | Sami | 0.038854 |
| Sami | Nepalese | 0.038854 |
| Hungarian | Norwegian | 0.042420 |
| Indian | Russian | 0.044364 |
| Basque | Swedish | 0.048294 |
Here’s the dataset:
https://www.dropbox.com/s/zwt1bcqqmqkleca/mtDNA.zip?dl=0
Here’s the code:
https://www.dropbox.com/s/re0ww4yisdstx5z/NN%20Population_CMDNLINE.m?dl=0
Any missing code is included in my paper, A New Model of Computational Genomics.
Discover more from Information Overload
Subscribe to get the latest posts sent to your email.
