Introduction
In a previous article, I showed that there are only 6 maternal lines that are a 99% match to 67.64% of global maternal lines, using a dataset of 377 complete mtDNA genomes, from 32 ethnicities. This suggests, that as a general matter, human beings are already extremely diverse, since a majority of the global population can be traced back to just a handful of maternal lines. There’s still the question of how we should measure this, and in this article, I’ll present a few methods that will allow us to quantify exactly how diverse a given population is.
Counting the Number of Maternal Lines in a Population
In the previous article, we counted the number of global maternal lines by building mutually exclusive clusters over the entire dataset of 377 genomes. This was done by first building a cluster of 99% matches for each genome in the dataset. That is, for a given genome A, if genome B has 99% of its bases in common with genome A, then genome B is included in the cluster for Genome A. We then sort the clusters by size, beginning with the largest cluster, and allocating all of the genomes in the largest cluster to that cluster, and removing them from all others. We then do this for the next largest cluster, and so on. This eventually produces mutually exclusive clusters.
If we limit this process to a given population, we will create mutually exclusive clusters that all belong to the same population. For example, if we begin with all of the Japanese genomes, and then apply this process, we will produce mutually exclusive clusters, each of which consists of genomes that are a 99% match to some given genome. As a consequence, this will partition a given population into distinct maternal lines, with each cluster containing genomes that are part of a distinct maternal line within the population in question. The table below shows the total number of genomes in each population, the number of clusters (i.e., distinct maternal lines) in each population, and the average cluster size, for each of the 32 population ethnicities. As you can see, the only truly homogenous populations are the Kazakh, Nepalese, and Iberian Roma, whereas everyone else is fairly heterogenous.
| Ethnicity | No. Genomes | No. Clusters | Avg. Cluster Size |
| 1. Kazakh | 30 | 6 | 5.00 |
| 2. Nepalese | 20 | 3 | 6.67 |
| 3. Iberian Roma | 19 | 1 | 19.00 |
| 4. Japanese | 20 | 10 | 2.00 |
| 5. Italian | 19 | 10 | 1.90 |
| 6. Finnish | 20 | 13 | 1.54 |
| 7. Norwegian | 20 | 9 | 2.22 |
| 8. Swedish | 20 | 8 | 2.12 |
| 9. Chinese | 20 | 12 | 1.67 |
| 10. Indian | 18 | 7 | 2.57 |
| 11. Nigerian | 9 | 6 | 1.50 |
| 12. Egyptian | 20 | 8 | 2.50 |
| 13. Russian | 6 | 3 | 2.00 |
| 14. Spanish | 13 | 9 | 1.44 |
| 15. Danish | 9 | 5 | 1.80 |
| 16. Maritime Archaic | 10 | 6 | 1.67 |
| 17. Ashkenazi Jewish | 18 | 6 | 3.00 |
| 18. Scottish | 18 | 10 | 1.80 |
| 19. Mexican | 3 | 3 | 1.00 |
| 20. Chachapoya | 10 | 6 | 1.67 |
| 21. Pre-Roman Egyptian (4,000 B.P.) | 1 | 1 | 1.00 |
| 22. Homo Heidelbergensis | 1 | 1 | 1.00 |
| 23. Mayan | 10 | 4 | 2.50 |
| 24. Khoisan | 10 | 10 | 1.00 |
| 25. English | 9 | 7 | 1.29 |
| 26. Ancient Roman | 5 | 2 | 2.50 |
| 27. Sardinian | 5 | 2 | 2.50 |
| 28. Basque | 4 | 2 | 2.00 |
| 29. Georgian | 2 | 2 | 1.00 |
| 30. German | 9 | 7 | 1.29 |
| 31. Denisovan | 1 | 1 | 1.0 |
| 32. Neanderthal | 1 | 1 | 1.0 |
Measuring the Global Reach of a Population
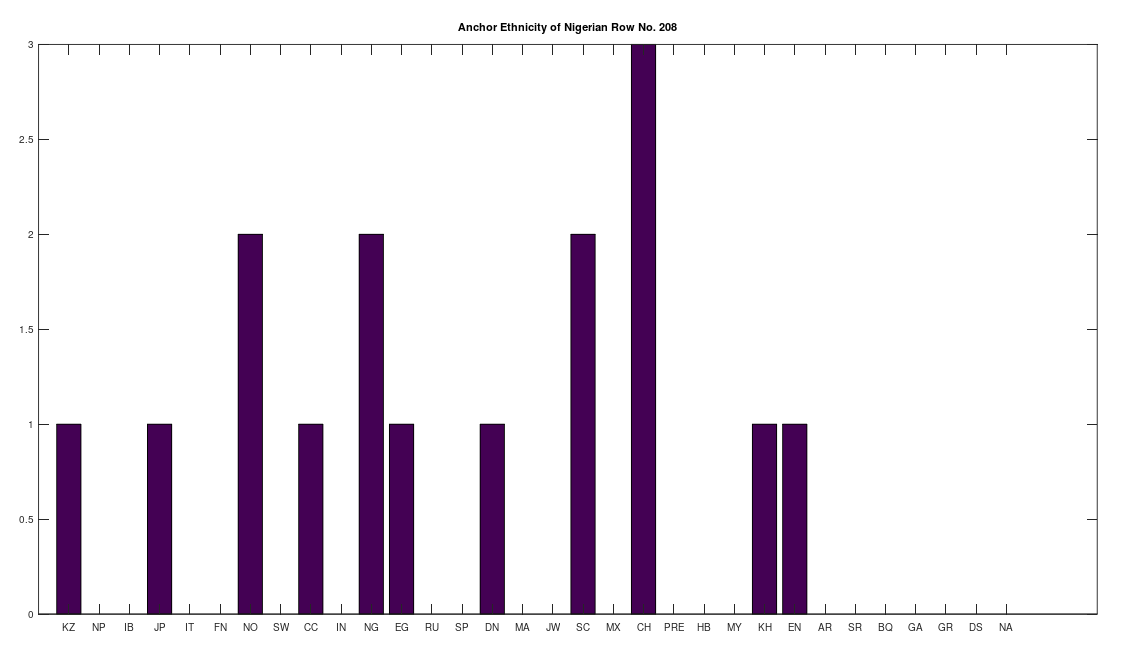
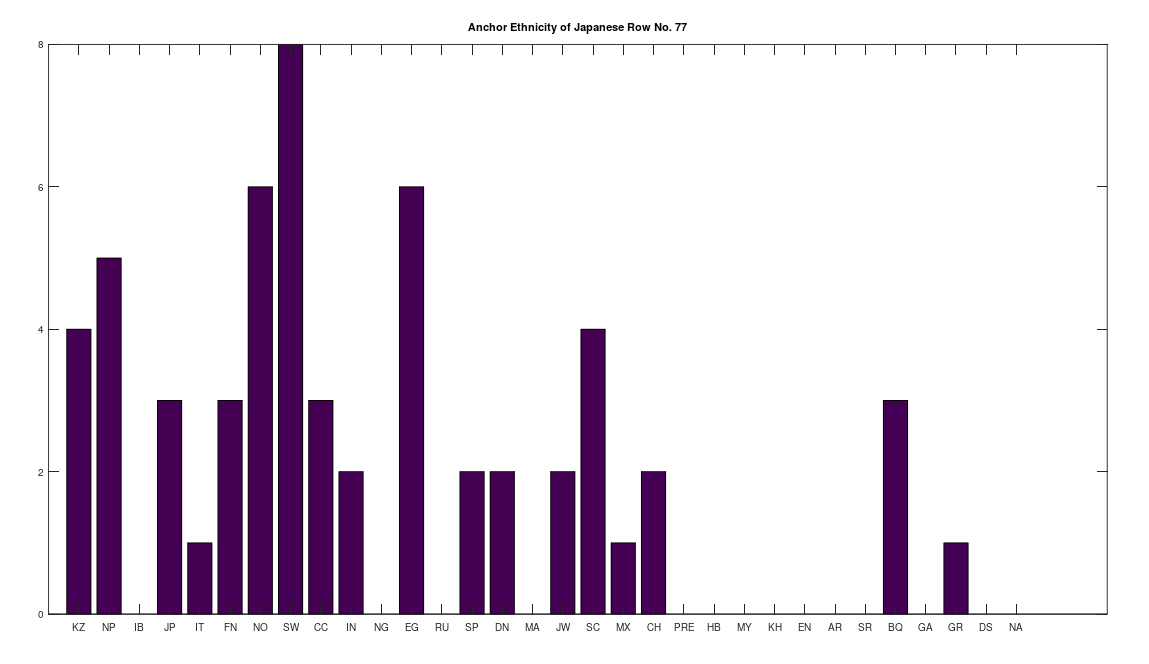
We can apply a similar process for a selected population over the entire dataset. That is, we first take all of the genomes in a given selected population, and then build clusters by finding all other genomes, over all populations, that are a 99% match with a given genome from the selected population. We then build mutually exclusive clusters in the exact same manner we did above, first sorting by cluster size, and then allocating the matching genomes in size order. This will allow us to find the breadth of global populations that match to a given genome from the selected population, and will again partition the population, because not all genomes from the selected population will produce non-empty clusters. However, in this case, we will consider every non-empty cluster, rather than impose a minimum size. This will allow us to distinguish between a population that is simply heterogenous, as opposed to global. For example, Nigerians are heterogenous in that they have numerous maternal lines, however only one of the maternal lines is truly global, which shows a plain connection to Northern Europeans, Norwegians and Scotts in particular. It’s tempting to write these connections off due to the slave trade, but this just doesn’t really hold up in the case of Japan and China, or even more peculiar, Kazakstan and the Chachapoyas. The bottom line is that an ethnically Nigerian maternal line is a basically perfect match for the ethnicities below, which does not have a simple explanation in known history (to my knowledge). In my opinion, it makes much more sense to instead assume that truly inexplicable cases like these are due to ancient migration patterns that are still observable today, simply because mtDNA doesn’t change much over time, and in some cases, enormous periods of time.
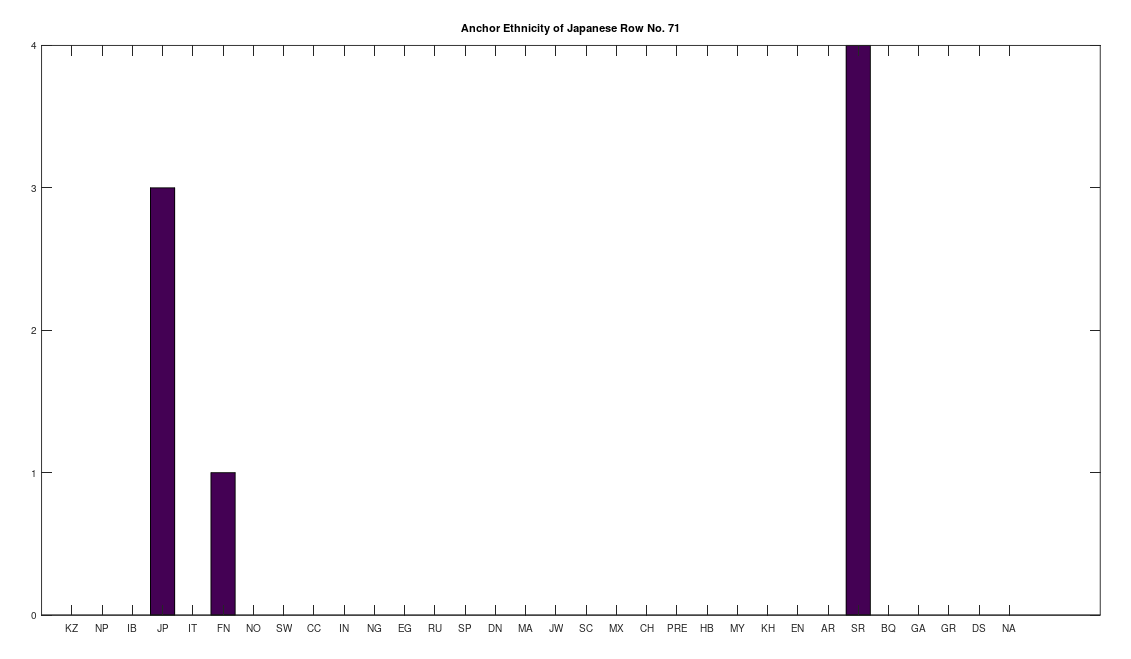
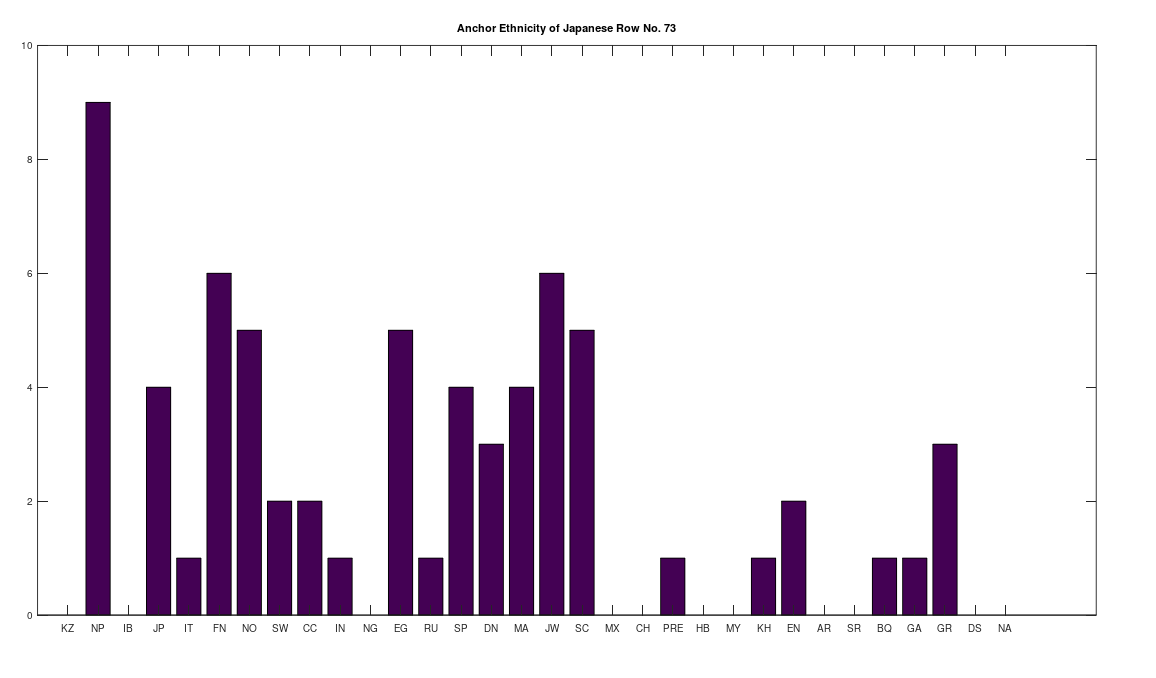
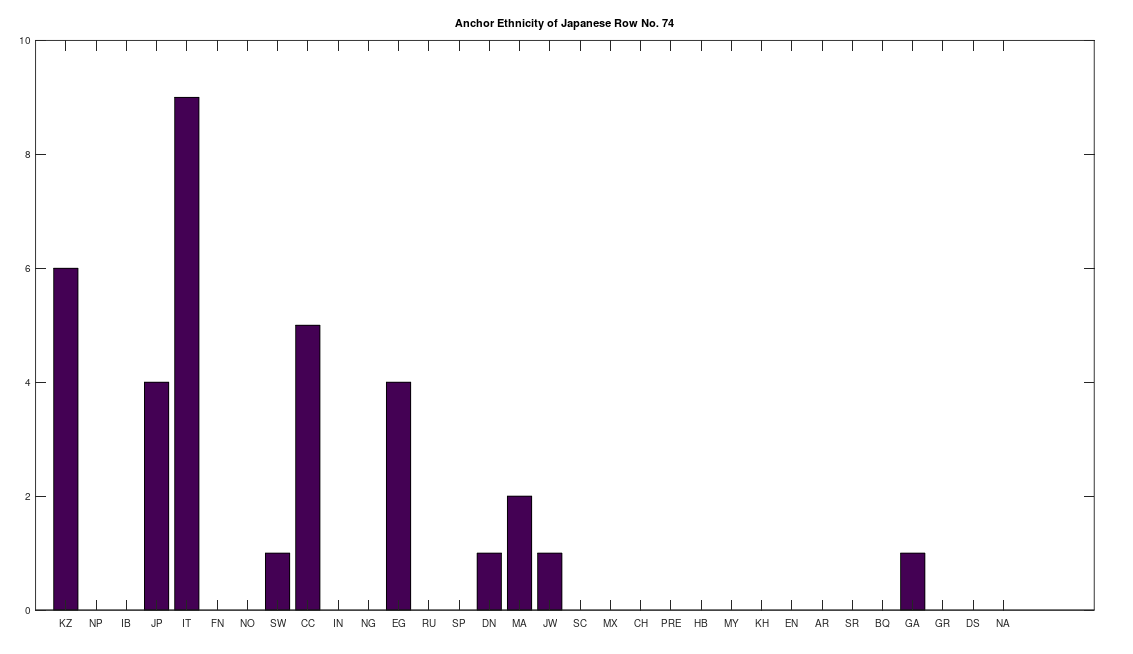
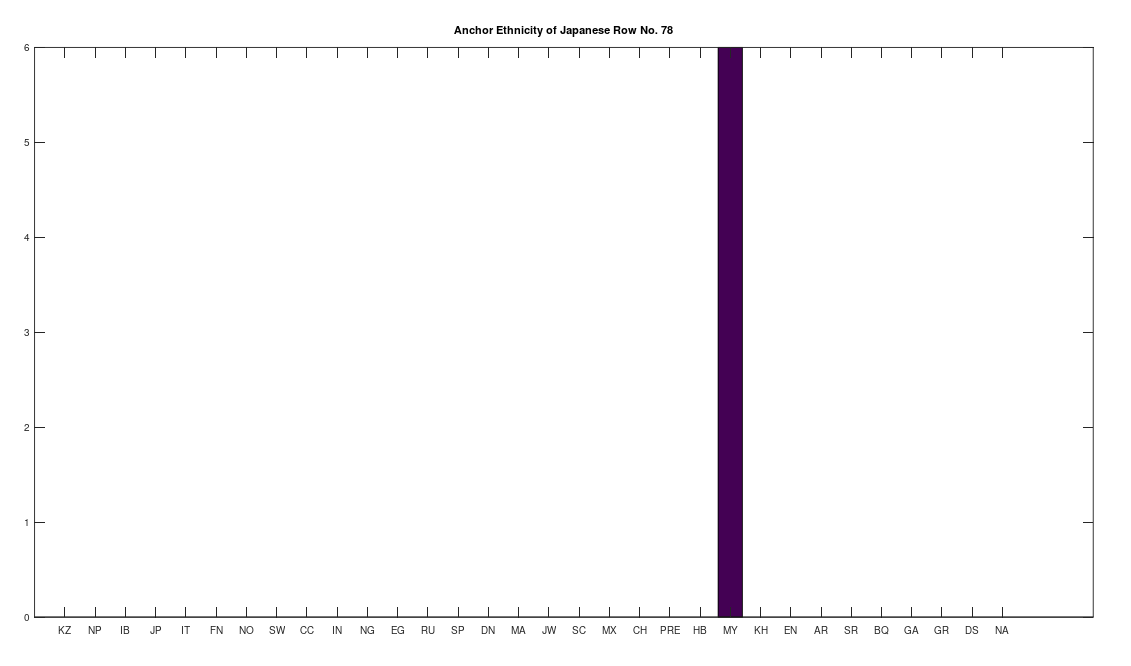
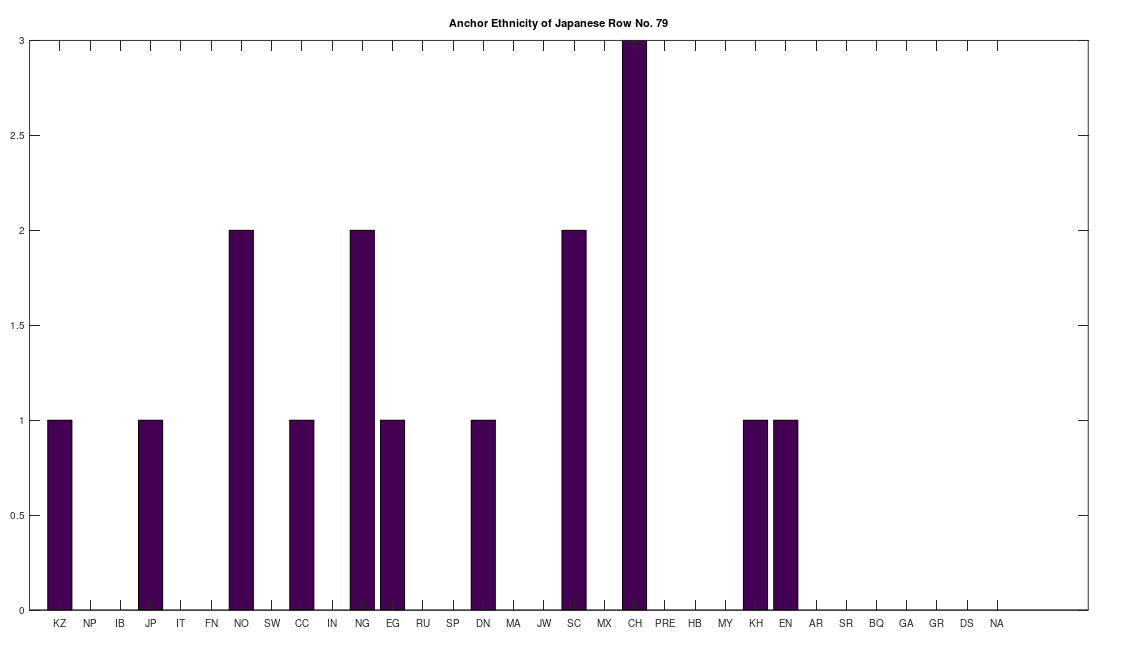
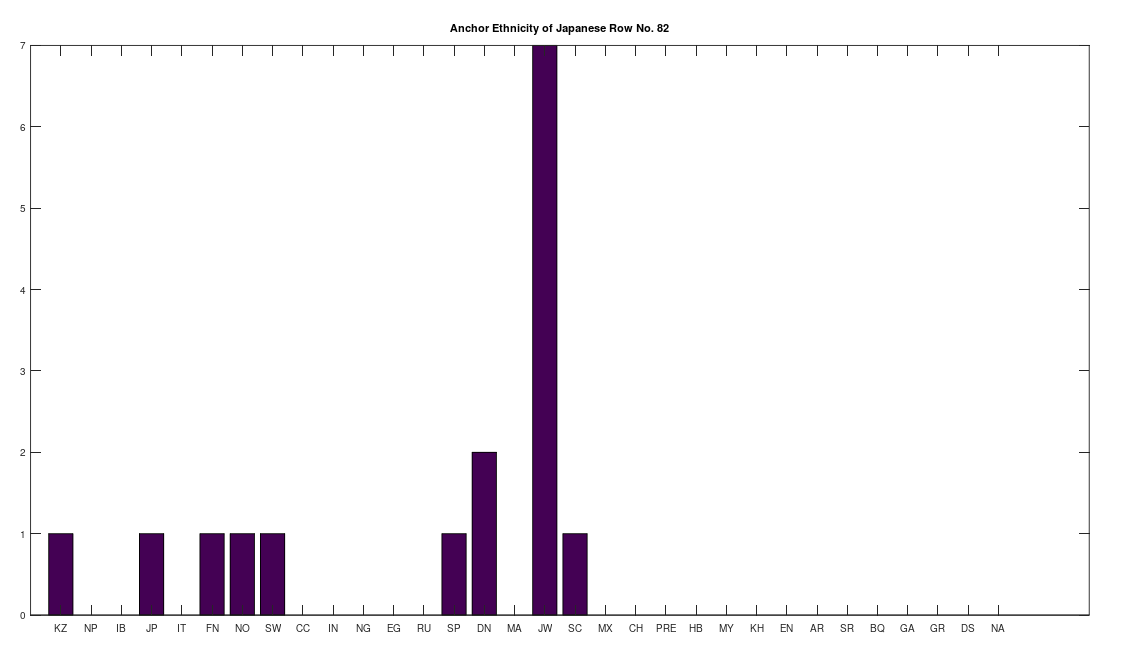
Applying this to the Japanese population, this produces 11 clusters, with a total of 210 genomes, or 56% of the dataset, which suggests that the Japanese maternal line is quite global, despite the reputation of being an insular nation. It turns out that Japan is only recently insular, as it started in the 1600’s in response to Spanish, Portuguese, and Catholic attempts to impose colonial rule, and even enslave Japanese people. This of course leaves open the rest of human history, which is hundreds of thousands of years old, providing plenty of opportunity for the diversity that is obviously present in literally every population, other than the Kazakhs, Roma, and Nepalese people. In the case of the Japanese, you see a simply incredible scope of global populations, and below are the most interesting clusters I noticed. Among them is a Japanese genome that is a perfect match for 6 out of the 10 Ancient Mayan genomes, and nothing else, suggesting the individual in question is quite literally of Ancient Mayan heritage.
Keep in mind the dataset has been diligenced to ensure that the GenBank notes either explicitly state or plainly suggest that the person in question is of the ethnicity in question. Moreover, there’s a link for each genome to the NIH Database, where you can check the provenance yourself. So if e.g., a genome is classified as Japanese, then the GenBank notes indicate that the person is ethnically Japanese, as opposed to the genome simply being collected from a person in Japan. Because of this, and the 99% threshold, you simply cannot argue with these results: humanity is already extremely diverse, suggesting a rich and ancient history that is arguably unknown to us, that will probably be discoverable at least initially only through genetics, rather than archaeology. Because mtDNA is so stable over time, it makes perfect sense as the initial point of inquiry.
Again, the only things you need to allow for expansive global trade are sailboats and telescopes, and the bottom line is, the people of Polynesia got there somehow, and they certainly didn’t use unguided rowboats. Moreover, the Ancient Romans had glass, and careful observation of optics through water would suggest that vision can be adjusted using materials, including of course glass, which was plainly known to at least one ancient civilization. Finally, below is a table that shows the number of genomes per population, together with the applicable acronym used in the charts above, and below that is the dataset and command line code.
| Ethnicity | Genome Count | Abbreviation |
| 1. Kazakh | 30 | KZ |
| 2. Nepalese | 20 | NP |
| 3. Iberian Roma | 19 | IB |
| 4. Japanese | 20 | JP |
| 5. Italian | 19 | IT |
| 6. Finnish | 20 | FN |
| 7. Norwegian | 20 | NO |
| 8. Swedish | 20 | SW |
| 9. Chinese | 20 | CC |
| 10. Indian | 18 | IN |
| 11. Nigerian | 9 | NG |
| 12. Egyptian | 20 | EG |
| 13. Russian | 6 | RU |
| 14. Spanish | 13 | SP |
| 15. Danish | 9 | DN |
| 16. Maritime Archaic | 10 | MA |
| 17. Ashkenazi Jewish | 18 | JW |
| 18. Scottish | 18 | SC |
| 19. Mexican | 3 | MX |
| 20. Chachapoya | 10 | CH |
| 21. Pre-Roman Egyptian (4,000 B.P.) | 1 | PRE |
| 22. Homo Heidelbergensis | 1 | HB |
| 23. Mayan | 10 | MY |
| 24. Khoisan | 10 | KH |
| 25. English | 9 | EN |
| 26. Ancient Roman | 5 | AR |
| 27. Sardinian | 5 | SR |
| 28. Basque | 4 | BQ |
| 29. Georgian | 2 | GA |
| 30. German | 9 | GR |
| 31. Denisovan | 1 | DS |
| 32. Neanderthal | 1 | NA |
Here’s the dataset:
https://www.dropbox.com/s/8jlwr49fhtstpre/mtDNA.zip?dl=0
Here’s the command line code:
https://www.dropbox.com/s/4v1fo2hkt76pjws/Count%20Unique%20Population%20Genomes.m?dl=0
https://www.dropbox.com/s/hi1ggfgqnat1dwo/Mut_Exc_Clusters_By_Class.m?dl=0
Discover more from Information Overload
Subscribe to get the latest posts sent to your email.
