Introduction
We know that many living humans carry archaic DNA, specifically people in Iceland and Polynesia, and likely many others. However, mtDNA is inherited from one generation to the next along the maternal line, with almost no mutations. As a consequence, if there is any nexus between archaic humans and modern humans, then that nexus should be strongest along the maternal line, specifically, as captured by mtDNA. As it turns out, many modern humans globally are a near perfect match on their maternal line for Homo heidelbergensis, and some are a good match for Denisovans.
Technical Notes
I’ve assembled a dataset of 377 complete human mtDNA genomes from the NIH Database, taken from 32 ethnicities, including several ancient and archaic ethnicities. All of the genomes have been diligenced to ensure that the GenBank notes associated with the genomes imply the actual ethnicities, as opposed to just the location of the individual. That is, if the classifier for a genome is Chinese, then the GenBank notes explicitly state or plainly suggest that the sample is in fact from an ethnically Chinese person, as opposed to a genome collected in China. The dataset includes one complete Homo heidelbergensis genome, and one complete Denisovan genome.
The method of comparison involves counting matching bases, after a simple alignment that shifts the entire genome (if at all), to align it to what is plainly a globally common sequence of 15 bases. This is also apparently the default NIH alignment, which you can see for yourself by looking through their database. See e.g., these three genomes: Genome 1, Genome 2, and Genome 3, all of which contain exactly the same opening 15 characters. Because mtDNA is circular, this is plainly a deliberate starting point that we use as well, for simplicity. Finally, note that most of the genomes do not need to be shifted at all, because the NIH presents nearly all of the genomes I’ve seen using exactly the same alignment. Specifically, only 5 out of the 377 genomes in the dataset were shifted by an average of 2 bases.
As a consequence, I do not account for insertions and deletions outside of the opening sequence, and this is deliberate, since insertions and deletions are associated with drastic changes in behaviors and morphologies, in contrast to point mutations. For example, both Down Syndrome and Williams Syndrome are the result of insertions and deletions, and they both produce drastic behavioral and morphological changes. As a consequence, the method I employ is much more stringent than e.g., the one employed by NIH Blast, which will segment a genome and look for local alignments that maximize matching bases. That is, if two genomes produce e.g., a 99% match in the method I use, then they really are a 99% match over the entire genome, unadjusted, save for any shifting necessary to align the genomes to a common opening sequence of 15 bases, which again is unnecessary for the vast majority of genomes. Finally, note that the Heidelbergensis and Denisovan genomes were not shifted at all during the alignment process, and again, only 1.326% of the dataset required shifting.
Application to Data
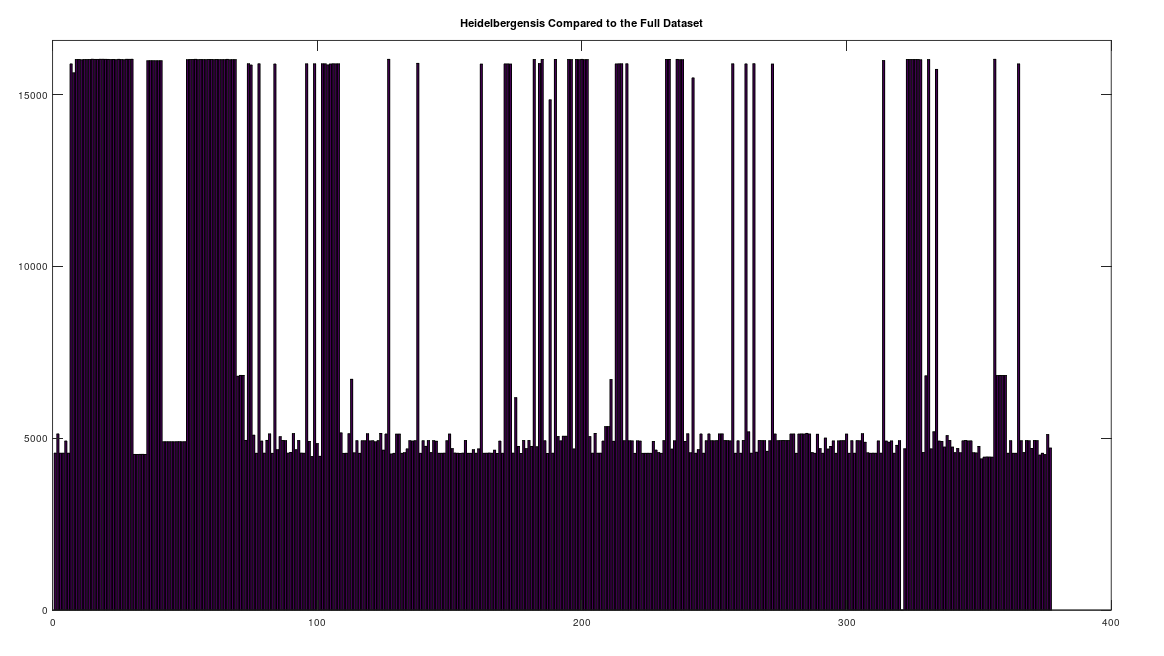
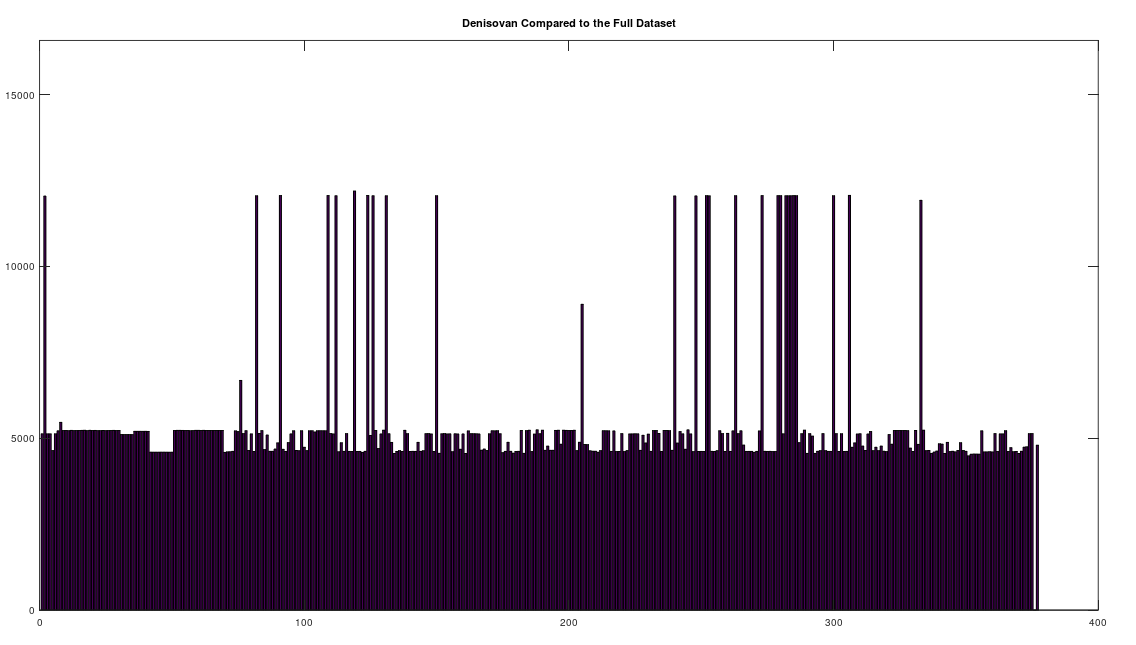
We begin by simply plotting the number of matching bases between the Heidelbergensis and Denisovan genomes, and the entire dataset. Both plots are shown below. As you can see, the number of individuals that are a strong match with Heidelbergensis exceeds the number of individuals that are a strong match to Denisovan. Moreover, the match count is also plainly higher for Heidelbergensis, suggesting that many people are a near-perfect match to Heidelbergensis, whereas only some people are a strong match to Denisovan.
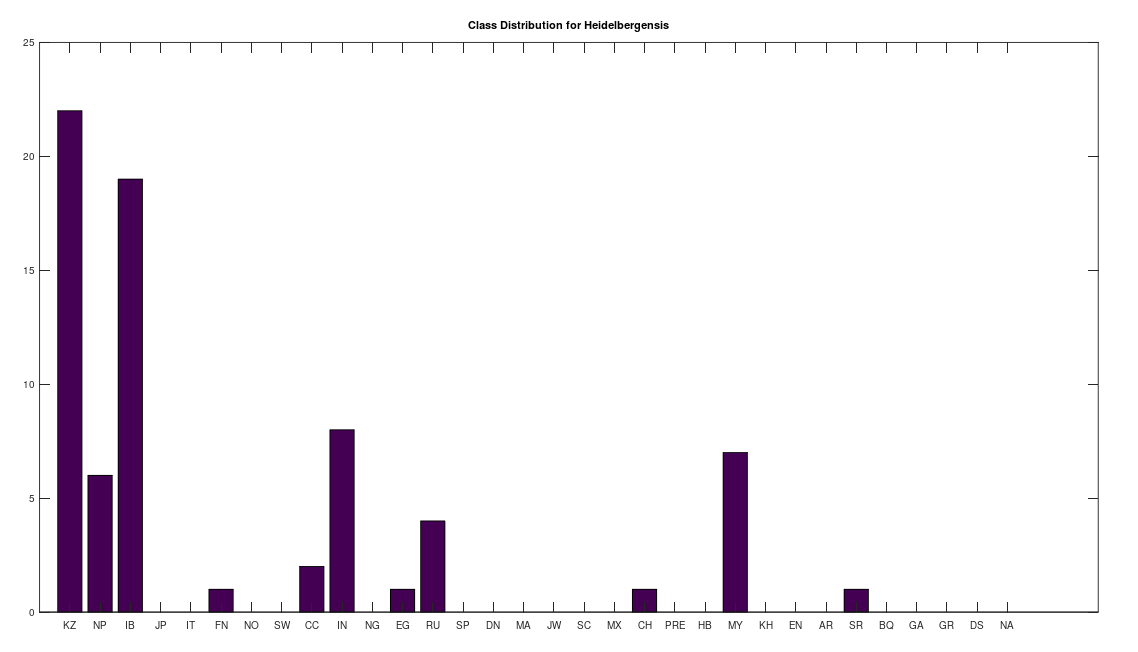
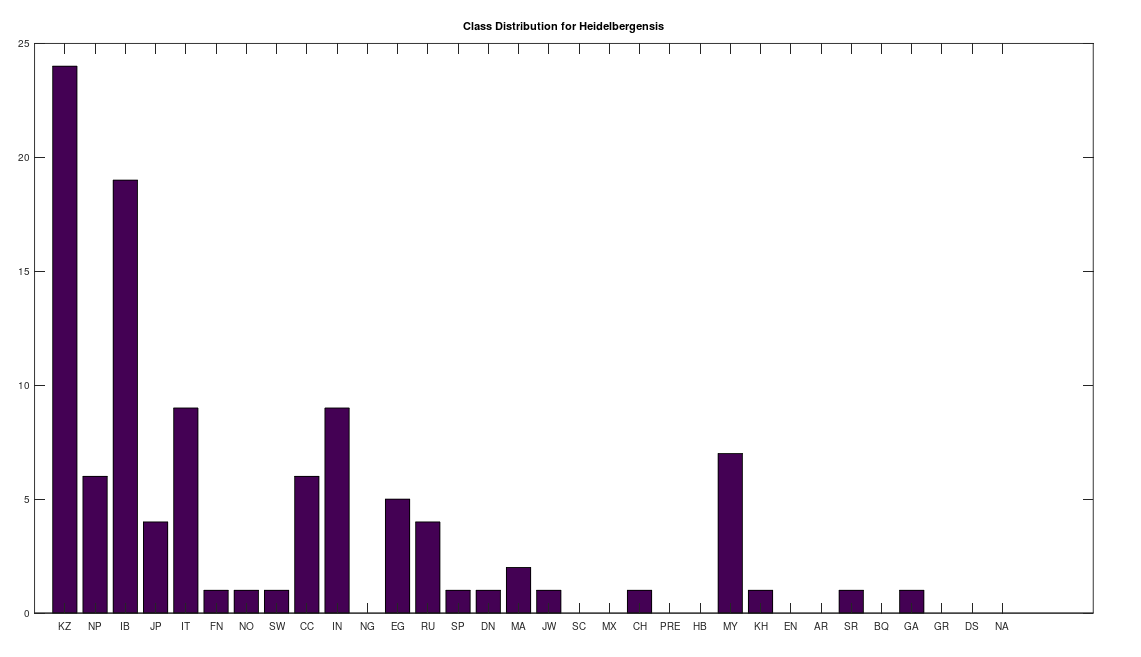
We can conduct similar analysis by population ethnicity, and we’ll begin with Heidelbergensis, setting the minimum match percentage to 96%, and then counting the number of genomes in each population that are a 96% match to Heidelbergensis. This is shown in the plot below. Note that a minimum match percentage of 97% produces an empty set, and so 96% is the maximum whole-number percentage that produces a non-empty set. Therefore, the populations below represent some of the strongest matches to Heidelbergensis. The population names and their corresponding acronyms can be found in a table at the end of the article. Also note that the number of genomes per population is not uniform, and can also be found in the same table below. As you can see, the matches are concentrated in the Kazakh and Roma populations, which contain 30 and 19 genomes, respectively, in the full dataset. This implies that 73% of Kazakh and 100% of Roma are likely direct descendants of Heidelbergensis. The distribution below contains a total of 72 genomes, suggesting that 19% of the global population are direct descendants of Heidelbergensis.
We can conduct the exact same analysis for Denisovan, however as noted above, the match count is not as strong. Specifically, a minimum match percentage of 74% produces an empty set, 73% produces exactly one Finnish genome, and 72% produces a global distribution that contains 25 genomes, which is shown below. As you can see, the distribution is concentrated in the Finnish and Ashkenazi Jewish populations, which contain 20 and 18 genomes, respectively, in the full dataset. This implies that 25% of Finns and 44% of Ashkenazi Jews are closely related to Denisovans. Again, this distribution contains 25 genomes, suggesting that 7% of the global population are closely related to Denisovans.
Comparison to the Global Population
As demonstrated above, many modern humans are closely related to archaic humans on the maternal line. This makes perfect sense, since we know that Homo sapiens mated with archaic humans. Because this is known to have occurred, and because mtDNA is transmitted from one generation to the next without much (if any) mutation, it follows that at least some modern humans should be closely related to archaic humans, which seems to be the case, with 24% of the dataset either directly descended from or closely related to an archaic human.
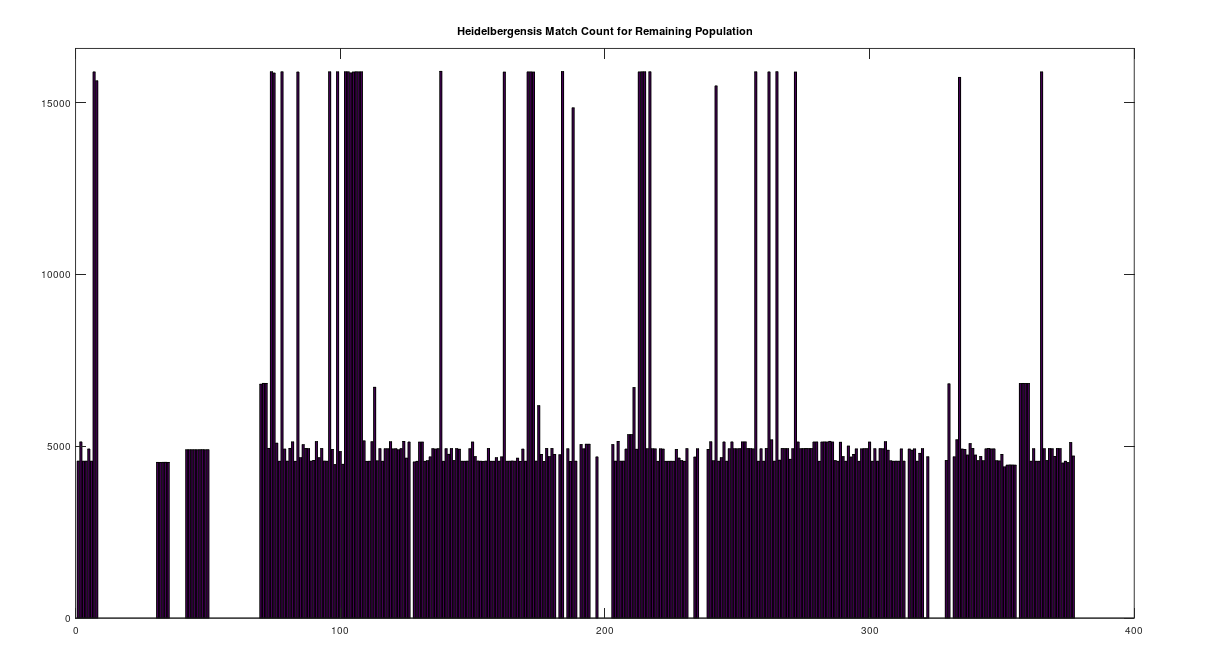
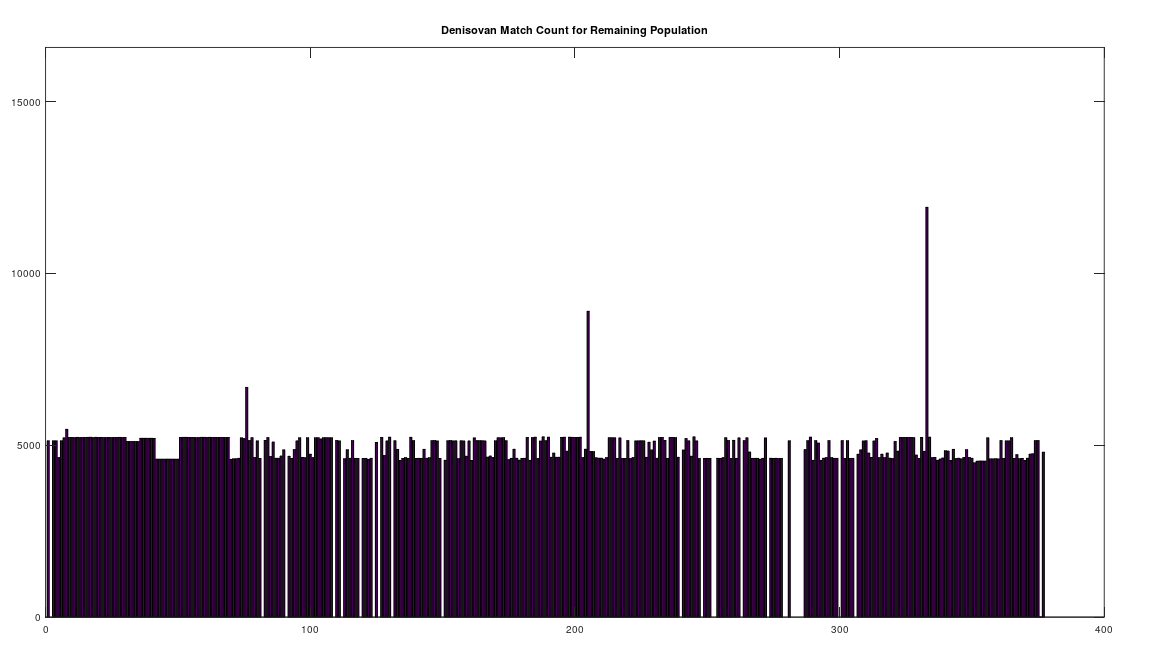
We can further analyze how much mtDNA the rest of the global population has in common with both Heidelbergensis and Denisovans. Note that chance alone should produce a match percentage of 25%. As noted above, there are 72 genomes that have a 96% match to Heidelbergensis. Above we plot the match count for the remaining 305 genomes in the dataset, with the 72 genomes set to zero, preserving the original genome indexes in the dataset. As you can plainly see, the first analysis was too stringent, leaving a significant number of individuals with a close genetic relationship to Heidelbergensis, whereas the vast majority have a relationship close to chance (i.e., around 1/4 of the full genome size, which is 
We can easily remedy this by setting the minimum match count to 14,000 bases, which is 84% of the full genome. The plot below shows the distribution by ethnicity after lowering the minimum match percentage to 84%. This plot contains 105 genomes, suggesting that 28% of the global population is very closely related to Heidelbergensis, whereas 62% have a relationship that is close to chance. You can see a few significant populations were added, in particular Japanese and Italian. Note that because of the way mtDNA is inherited, it’s not surprising at all that most people have basically nothing in common with Heidelbergensis beyond chance, because you either get the whole genome (possibly with some mutations) or not at all. As a consequence, if you substitute a random row from the dataset, you’ll get similar results. What is surprising is that archaic bloodlines persist to this day on the maternal side in such large numbers.
We still have the question of how it is that partial matches beyond chance occur at all, given that mtDNA is generally transferred from mother to child, without any significant mutations at all, and sometimes none whatsoever. This can be explained by assuming that small or even significant mutations are possible, but unlikely. This would produce partial matches of varying percentages over time. However, this does not on its own allow you to say how far back a given relationship goes, since you could have a series of small mutations over a long period of time, or one recent significant mutation. It does however explain partial matches, and because genetics is largely mechanical, a significant match should produce significant similarities in some set of measurable traits or behaviors.
We can perform the same analysis for Denisovan, by plotting again the match count for the remaining genomes that did not constitute a 72% match to Denisovan. This is shown in the plot below. As you can see, in this case, only 3 genomes were not captured by the initial analysis, and moreover, the match counts are again not as strong, implying that the analysis above captured the approximately correct distribution of populations that are closely related to Denisovans. Again, the vast majority of the population have a relationship to Denisovan that is close to chance, though there are small contiguous bumps suggesting minor, population-specific relationships. This poses a fascinating question for Jewish people that I’m plainly not qualified to answer, which is, who is Jewish in this view? Specifically, Judaism is connected to the maternal line, and if it turns out that the history points to the Denisovans as being the ancestors of the historically Jewish people, then 7% of the world is Jewish according to this definition, which is significantly larger than the known population of Jews.
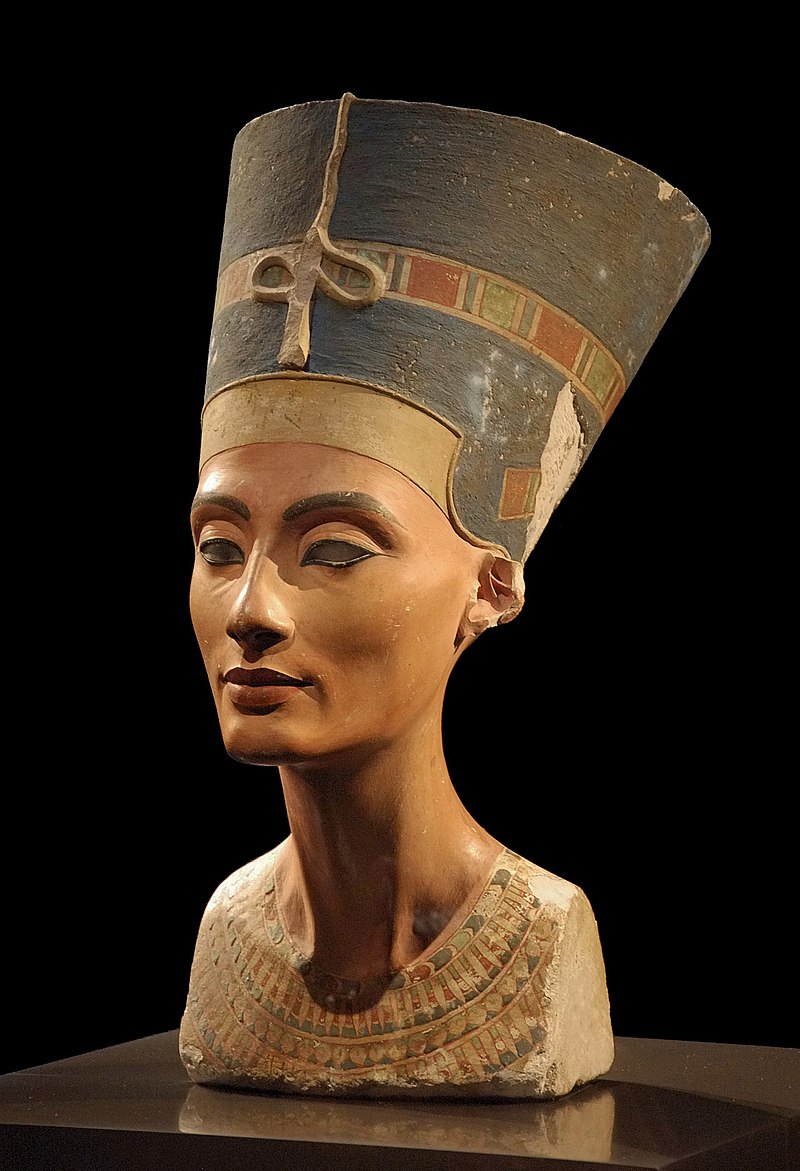
The Ashkenazi Jews are definitely related to some Maritime Archaic people, who are ancient people that lived in Canada, that exhibited insular behavior, since the ones related to the Jews are related only to each other, whereas the others are related to global populations. Many Germans are a 99% match for a Khoisan African individual, and some are a 99% match to a Japanese individual (see this article). Keep in mind, this is a reasonably sized dataset, that covers 32 global and ancient ethnicities, so you can’t dismiss these results as one-offs, because they’re not, and the world was plainly global, a very long time ago, or, we have only a handful of common global mothers, and in either case, it cannot be explained by slavery or colonialism – some of these genomes are from thousands of years ago, and they’re nearly perfect matches to modern, global, heterogenous populations. How could Jewish people end up in Canada thousands of years ago? How could a Nigerian be a 99% match to a Japanese person? Japan has no significant history of slavery, or colonialism in Africa. Keep in mind, because this dataset is not small, but not as a large as e.g., the NIH Database, it is fair to infer percentages, suggesting that, e.g., some significant percentage of Nigerian people are closely related to the Japanese, and many Germans are a basically perfect match to an ancient African population, the Khoisan, that is still alive today. These sound like absurd results, but look at the Pre-Roman Egyptians, they were obviously mixed-race people, and so a lot of us probably come from their line. They were also in North Africa, giving them access to plenty of other places after their likely collapse.
This was not true of their royalty after this period, during which, e.g., Cleopatra plainly had Mediterranean features, and it is known that their leaders came from other places throughout Europe. I suspect instead, the original Ancient Egyptians were ultimately from Nepal, having first left Africa, then traveling to Asia, with some, and certainly less than all coming back, as the Nepalese are astonishingly homogenous people genetically, with a plain resemblance to the Pre-Roman Egyptians.


This is really astonishing stuff, and it is impossible to argue with, as it follows from basic principles of genetics. All of this work tells me that our notions of race are almost always useless, often racist, and therefore in desperate need of a reevaluation. For Jewish people and others that connect religious identity to bloodlines, this is a big deal, but for the vast majority of people, I think it allows us to dispense with race altogether, save for scientific and personal inquiry into actual genetic ancestry, and instead focus on improving living conditions for all people. I did however, in another article, define scientific categories of ethnicities, that of course have no names, and group people together from all over the world, because that’s how it really is: you’re closely related to a bunch of people you never met that often live nowhere near you, and they might not look anything like you either, and that’s just life.
| Ethnicity | Genome Count | Abbreviation |
| 1. Kazakh | 30 | KZ |
| 2. Nepalese | 20 | NP |
| 3. Iberian Roma | 19 | IB |
| 4. Japanese | 20 | JP |
| 5. Italian | 19 | IT |
| 6. Finnish | 20 | FN |
| 7. Norwegian | 20 | NO |
| 8. Swedish | 20 | SW |
| 9. Chinese | 20 | CC |
| 10. Indian | 18 | IN |
| 11. Nigerian | 9 | NG |
| 12. Egyptian | 20 | EG |
| 13. Russian | 6 | RU |
| 14. Spanish | 13 | SP |
| 15. Danish | 9 | DN |
| 16. Maritime Archaic | 10 | MA |
| 17. Ashkenazi Jewish | 18 | JW |
| 18. Scottish | 18 | SC |
| 19. Mexican | 3 | MX |
| 20. Chachapoya | 10 | CH |
| 21. Pre-Roman Egyptian (4,000 B.P.) | 1 | PRE |
| 22. Homo Heidelbergensis | 1 | HB |
| 23. Mayan | 10 | MY |
| 24. Khoisan | 10 | KH |
| 25. English | 9 | EN |
| 26. Ancient Roman | 5 | AR |
| 27. Sardinian | 5 | SR |
| 28. Basque | 4 | BQ |
| 29. Georgian | 2 | GA |
| 30. German | 9 | GR |
| 31. Denisovan | 1 | DS |
| 32. Neanderthal | 1 | NA |
Here’s the dataset:
https://www.dropbox.com/s/ht5g2rqg090himo/mtDNA.zip?dl=0
Here’s the code:
https://www.dropbox.com/s/nrczoxeqezvnls1/Genetic_Preprocessing.m?dl=0
https://www.dropbox.com/s/nypxf52e4qc646h/Updated_Heidelbergensis_CMNDLINE.m?dl=0
https://www.dropbox.com/s/y19d8ein5wjxe3a/Genetic_Alignment.m?dl=0
https://www.dropbox.com/s/zhp7jfscmi6ohlk/Genetic_Nearest_Neighbor_Single_Row.m?dl=0
Discover more from Information Overload
Subscribe to get the latest posts sent to your email.
