Nationality is a combination of political sovereignty, and geography. For example, Russia currently controls Kaliningrad, and therefore, many of the people that live in Kaliningrad today are Russian by nationality. However, Kaliningrad is an exclave, and was previously part of the German Empire, then known as Königsberg. As a consequence, it is of course possible that many of the people that live in present-day Kaliningrad, are actually from families that were residents of Königsberg, with German, not Russian, heritage. Therefore, we can plainly distinguish between nationality, which is a consequence of political sovereignty, and ethnicity, which is genetic, and an objective invariant of any individual.
However, most people don’t know their true genetic ethnicity, and as a consequence, even ethnicity is only claimed, unless genetically tested. Moreover, even when ethnicity is genetically tested, the result is still tied to history and geography, in that genetic traits are distributed about the world. For example, you could simply move an entire population from location A to location B, and doing so could eventually give rise to a claimed ethnicity that disregards location A, simply due to poor record keeping. As a consequence, ethnicity, even when genetically tested, is still actually a distribution, since almost any ethnicity will have traits in common with others. Because mtDNA varies so little from one generation to the next, it should be even easier to limit the overlap between claimed ethnicities, though this is however not the case as a general matter. For example, many living human beings all over the world are a 99.7% match to a 4,000 year old Ancient Egyptian genome. Despite this, there is still a lot of variation, due to the fact that there were apparently many individual women that gave birth to the human race, and so what you find is that most ethnicities are in fact a combination of a large number of maternal ethnicities.
To test this, I’ve assembled clusters of genomes that are 99% matches with each other. That is, two genomes are part of the same cluster only if they have 99% of their bases in common. This is done for every row of the attached dataset, which contains 377 complete mtDNA genomes, from 32 global ethnicities, producing an initial 377 clusters of genomes (i.e., one for each row). The clusters are then sorted by size, and the largest cluster first claims all of its genomes, then the next largest, and so on, producing mutually exclusive clusters. As a consequence, the genomes that have the most in common with other genomes are associated with non-empty clusters, since they get first claim by virtue of sorting by cluster size. Note that these clusters define genetic ethnicities that are driven solely by genetic similarity, with no regard for history or geography at all. That is, they are comprised of maximally-sized, 99% matches on the maternal line, producing sizable populations that are closely related on the maternal line.

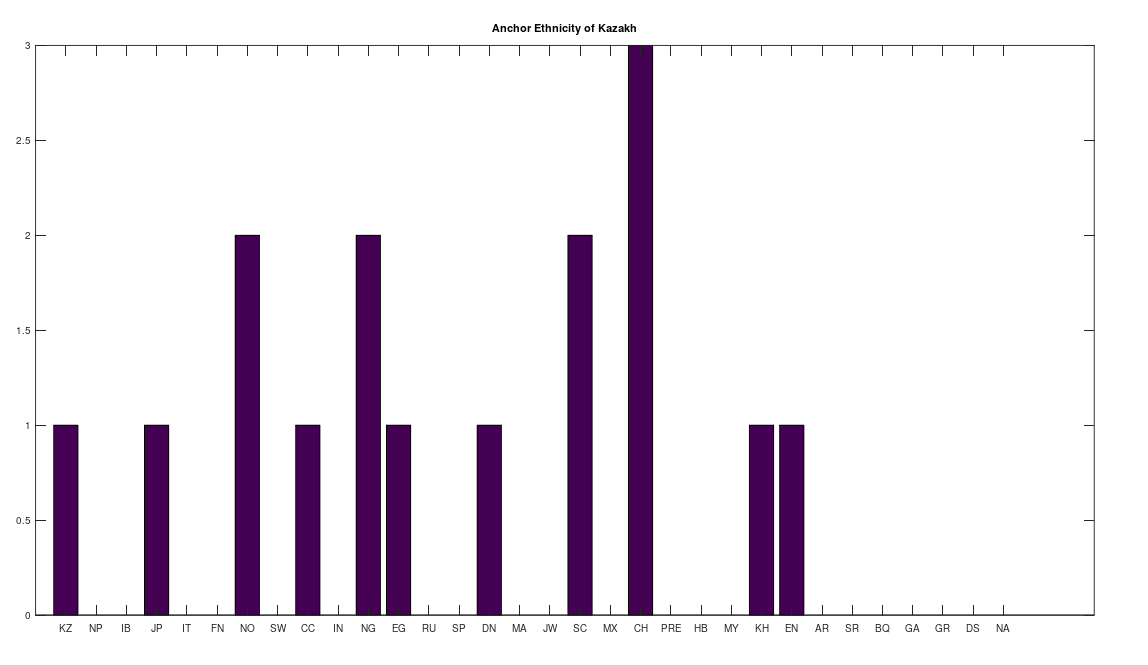


However, many of the clusters have only 1 or 2 genomes. If we instead focus on the clusters that have at least 10 genomes, this leaves 6 clusters, that together contain 255 genomes, or 67.64% of the genomes in the dataset. The 6 rows that survive are called “anchors”, and the title of each chart above shows the ethnicity of the applicable anchor genome that produced the cluster in question. I chose the word anchor because it doesn’t have a meaning in genetics, and these genomes are by definition connected to the largest number of genomes across the dataset. The distributions for each such cluster are also shown. The obvious point being, we are, as a general matter, heterogenous people, and even superficially homogenous nations like Denmark have 99% of their maternal lineage in common with global ethnicities.
Note that this process is arguably more meaningful than any one-off observation, since it leaves it up to a deterministic process to produce nearly perfectly matching, maximally-sized groups of people, on the basis of mtDNA alone. And though the dataset is small compared to e.g., the entire NIH Database, these are nonetheless complete genomes. Therefore, it is fair to conclude that there really are only a few true global maternal lines. Moreover, it also seems reasonable to conclude that there shouldn’t be too many maternal lines tied to a given claimed ethnicity or nationality. This makes perfect sense, since written history is a small fragment of our true history, which spans at least a few hundred thousand years, during which human beings apparently made it all over the world, in turn making it unlikely that any given maternal line could stay isolated and stationary for any appreciable amount of time.
Note that all of the genomes in the dataset have been diligenced to ensure that the classifier ethnicity for a given genome is a claimed ethnicity, rather than simply the location of the individual. That is, if the classifier is e.g., Indian, then the notes associated with the genome indicate that the person in question is ethnically Indian, as opposed to simply located in India. All of the genomes are from the NIH Database, and the dataset includes provenance files with links to the NIH Database for every genome in the dataset. Below is a table that shows the ethnicities included in the dataset, together with the number of genomes in each ethnicity, and their abbreviations in the charts above.
| Ethnicity | Genome Count | Abbreviation |
| 1. Kazakh | 30 | KZ |
| 2. Nepalese | 20 | NP |
| 3. Iberian Roma | 19 | IB |
| 4. Japanese | 20 | JP |
| 5. Italian | 19 | IT |
| 6. Finnish | 20 | FN |
| 7. Norwegian | 20 | NO |
| 8. Swedish | 20 | SW |
| 9. Chinese | 20 | CC |
| 10. Indian | 18 | IN |
| 11. Mexican | 9 | MX |
| 12. Egyptian | 20 | EG |
| 13. Russian | 6 | RU |
| 14. Spanish | 13 | SP |
| 15. Danish | 9 | DN |
| 16. Maritime Archaic | 10 | MA |
| 17. Ashkenazi Jewish | 18 | JW |
| 18. Scottish | 18 | SC |
| 19. Mexican | 3 | MX |
| 20. Chachapoya | 10 | CH |
| 21. Pre-Roman Egyptian (4,000 B.P.) | 1 | PRE |
| 22. Homo Heidelbergensis | 1 | HB |
| 23. Mayan | 10 | MY |
| 24. Khoisan | 10 | KH |
| 25. English | 9 | EN |
| 26. Ancient Roman | 5 | AR |
| 27. Sardinian | 5 | SR |
| 28. Basque | 4 | BQ |
| 29. Georgian | 2 | GA |
| 30. German | 9 | GR |
| 31. Denisovan | 1 | DS |
| 32. Neanderthal | 1 | NA |
Here’s the dataset:
https://www.dropbox.com/s/8jlwr49fhtstpre/mtDNA.zip?dl=0
Here’s the command line code:
https://www.dropbox.com/s/zli642mod0qo5f5/Mutually_Exc_Clusters_CMDNLINE.m?dl=0
Discover more from Information Overload
Subscribe to get the latest posts sent to your email.
