As I noted previously, when you compare the complete human mtDNA genomes of two individuals that have a high match count, you produce a characteristic upward sloping curve. In contrast, if the two genomes have a low match count around chance, then it produces a downward sloping curve. Specifically, begin at index 1 of two aligned genomes, and calculate the average number of matching bases from index 1 to index K, and increase K over the entire genome. This is shown below, where 10 Nigerian genomes are compared to a single Japanese genome. As you can see, most of them are not a match, whereas some of them are (at the top). This implies a fairly obvious classification and clustering algorithm, where two genomes are a match based upon the structure of the curve. Specifically, upward sloping is a match, and downward sloping is not. There’s a third case where the average number of matching bases plainly increases as a function of index, but isn’t a spot on match. If such a curve meets the minimum match count of 13,000 matching bases, and such a curve is the nearest neighbor of an input comparison curve, then it will be treated as producing a match. If however, either of those criteria are not met, then the comparison will be treated as a non-match. You can of course treat these cases differently, but this is how the attached algorithm functions.
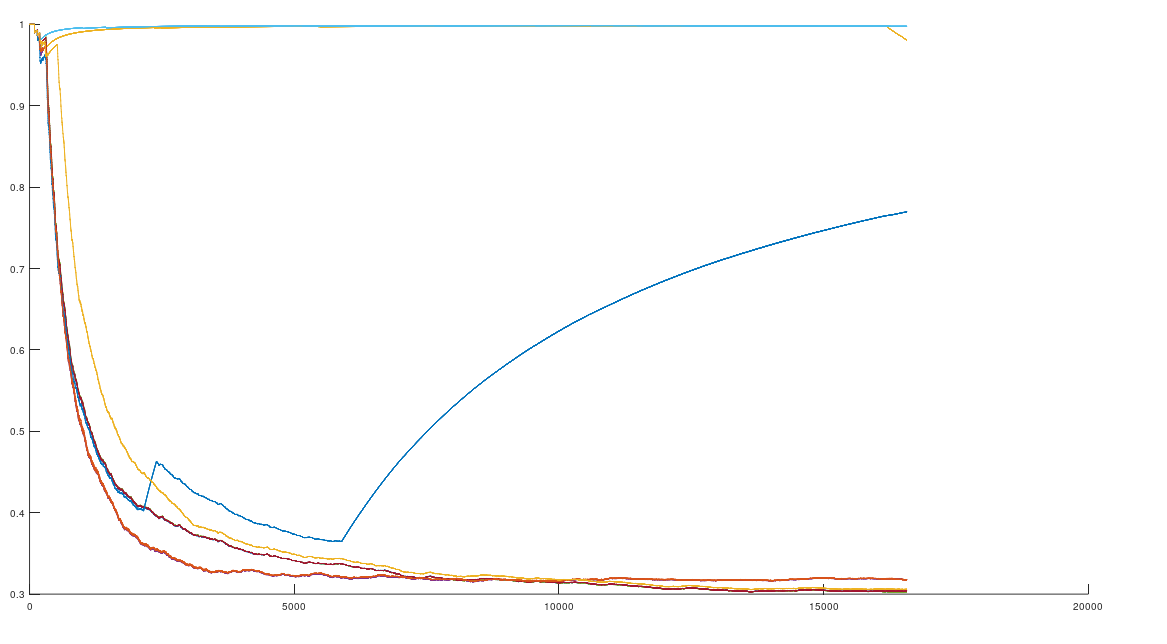
The average number of matching bases (y-axis) as a function of genome index (x-axis).
Specifically, I produced a training dataset of 381 curves, by finding the nearest neighbor of each row in the dataset. If the input and its nearest neighbor have at least 13,000 bases in common (i.e., about 78% of the complete genome), then the resultant curve is stored, and its classifier is a “match”. In contrast, if the threshold is not met, the curve is disregarded. I then generated a dataset of “dudd” curves, i.e., non-matches, by finding the genome that has the lowest number of bases in common with an input genome. If this “furthest neighbor” has no more than 6,000 bases in common with the input genome, then the curve is stored as a “non-match”. If the match count exceeds 6,000 bases, the curve is disregarded.
I then compared every row in the genome dataset, which contains 200 complete mtDNA genomes from 18 nationalities, to a complete Homo Heidelbergensis mtDNA genome. This produces a curve for every row of the dataset, compared to Heidelbergensis, of the type shown above. I then ran Nearest Neighbor on the curve, over the training dataset, and tested whether the curve matches to a “good curve”, or a “dudd curve”. If it matches to a “good curve”, then the row is treated as a match for Heidelbergensis, and if instead it matches to a “dudd curve”, then it is not. The results are plotted below, which shows the number of matches, by nationality. As you can plainly see, many modern human beings have a very close genetic relationship to Homo Heidelbergensis, in particular the Iberian Roma, all of which are a match, using this methodology. If this sample is representative of the global population, then approximately 29% of the global population is closely related to this otherwise extinct archaic human population.
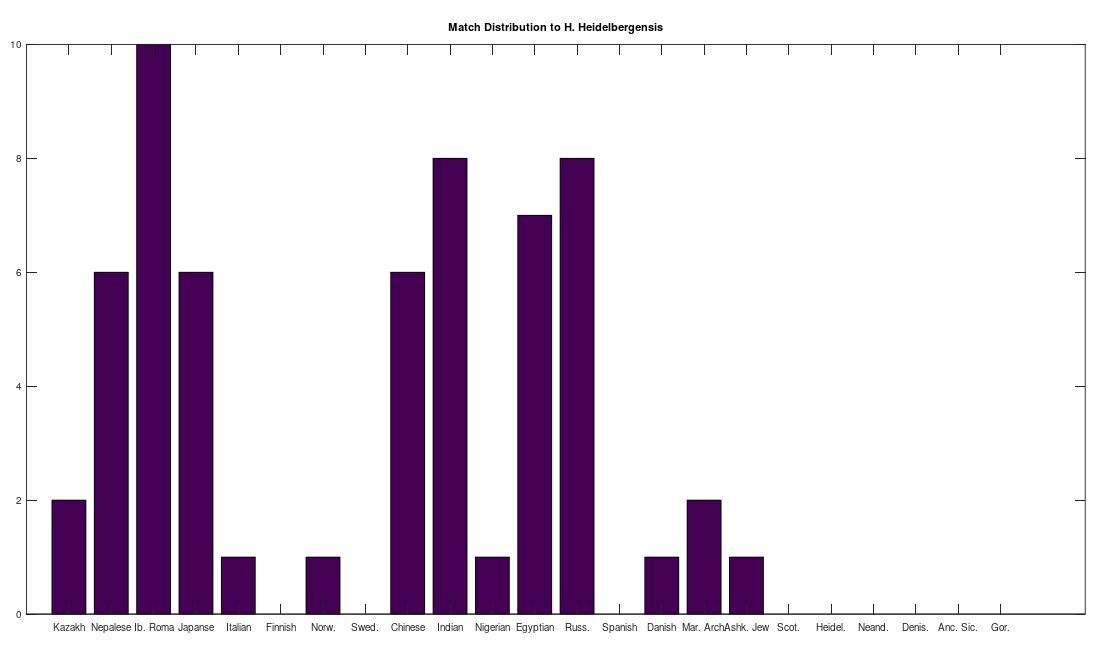
The number of individuals that match to Heidelbergensis, by nationality.
This is in some sense not terribly surprising, since, e.g., Icelandic people, and many Polynesians, carry significantly more archaic genes from ancestor species than most populations, specifically, Neanderthals and Denisovans, respectively. However, in this case, the match is strong, with many individuals that have more than 95% of their mtDNA in common with Heidelbergensis. In contrast, my understanding is that only a small portion of the complete Icelandic and Polynesian genome (i.e., all chromosomes, not just mtDNA), comes from archaic humans.
If you adjust the alignment, then the picture changes, with basically everyone producing a high match count, but this ignores the fact that many modern humans share the same insertions and deletions that are unique to Heidelbergensis. That is, this method aligns the genomes to what is plainly the standard NIH alignment, that has the exact same opening sequence of 15 bases for basically all of the genomes I’ve found, including all of the 200 genomes in this dataset, save for a few Japanese individuals that have minor deletions to this opening sequence. In contrast, taking a typical human mtDNA genome, and aligning it with Heidelbergensis in a manner that maximizes matching bases requires the deletion of roughly 300 bases. You can test this yourself by simply running a BLAST search on the Heidelbergensis genome that I used. In contrast, as you can plainly see, the individuals in the plot above match almost perfectly to Heidelbergensis, with no adjustment to the standard alignment. Note that all of the subspecies of Homo Sapiens contain exactly the same opening sequence of 15 bases, including Heidelbergensis, Denisovans, and Neanderthals, suggesting it is an objective alignment that is consistent across geography, and large scales of time, since Heidelbergensis was thought to have gone extinct several hundred thousand years ago. You can argue that this is in fact evidence that Heidelbergensis survived, and successfully assimilated into Homo Sapien populations, at least on the maternal line.
As a general matter, these modern humans have a much closer genetic relationship to Heidelbergensis than others. Moreover, insertions and deletions are associated with significant morphological and behavioral changes in human beings, unlike point mutations, which can cause diseases, but don’t, to my knowledge, typically change appearance and behavior. This suggests quite plainly that a significant portion of the modern global population could have morphological and behavioral traits in common with Heidelbergensis.
Attached is the code, together with the dataset, that will allow you to run this same analysis. The dataset contains the assembled dataset, and the raw genome files, together with the provenance of each genome, i.e., a link to the NIH Database.
https://www.dropbox.com/s/q1bhj8i7b4udnjr/Temp%20Code.zip?dl=0
https://www.dropbox.com/s/xacd04xdu9u1o63/mtDNA.zip?dl=0
Discover more from Information Overload
Subscribe to get the latest posts sent to your email.
