My basic image partition algorithm partitions an image into rectangular regions that maximize the difference between the average colors of adjacent regions. The same can be done over time, for example, when given a wave file that contains audio, other amplitude data, or any time-series generally. And the reasoning is the same, in that minor changes in timing prevent row by row comparison of two sets of observations over time, just like noise in an image prevents pixel by pixel comparison in space, making averaging useful in both cases, since you group observations together, blurring any idiosyncrasies due to small changes in observation.
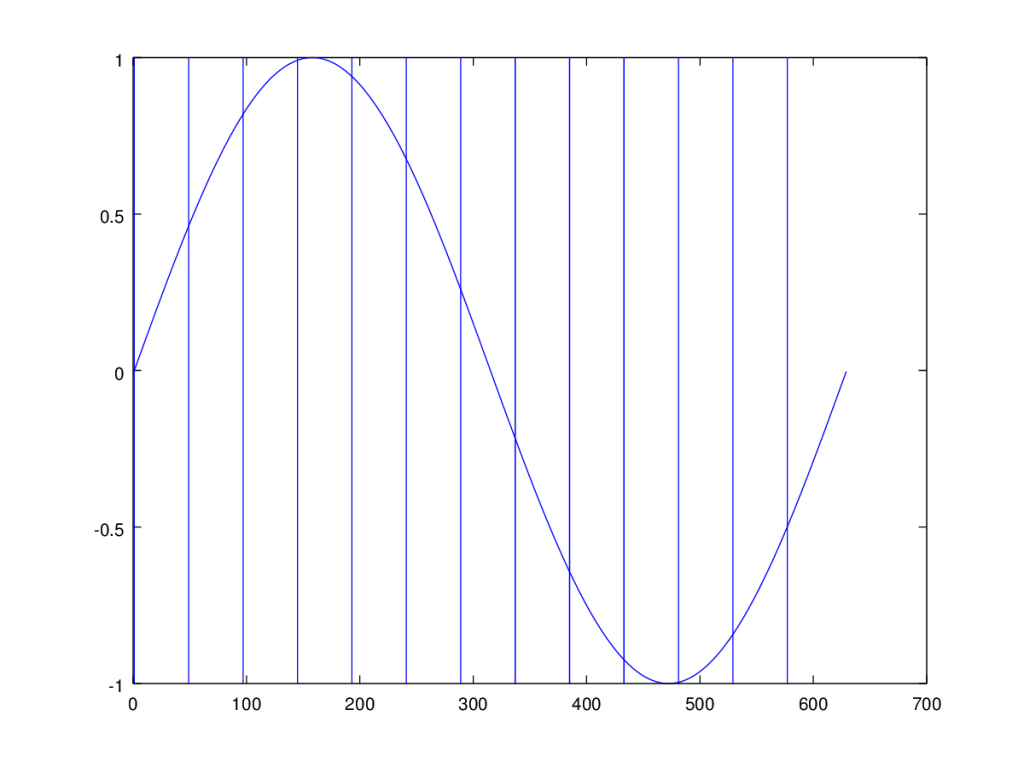
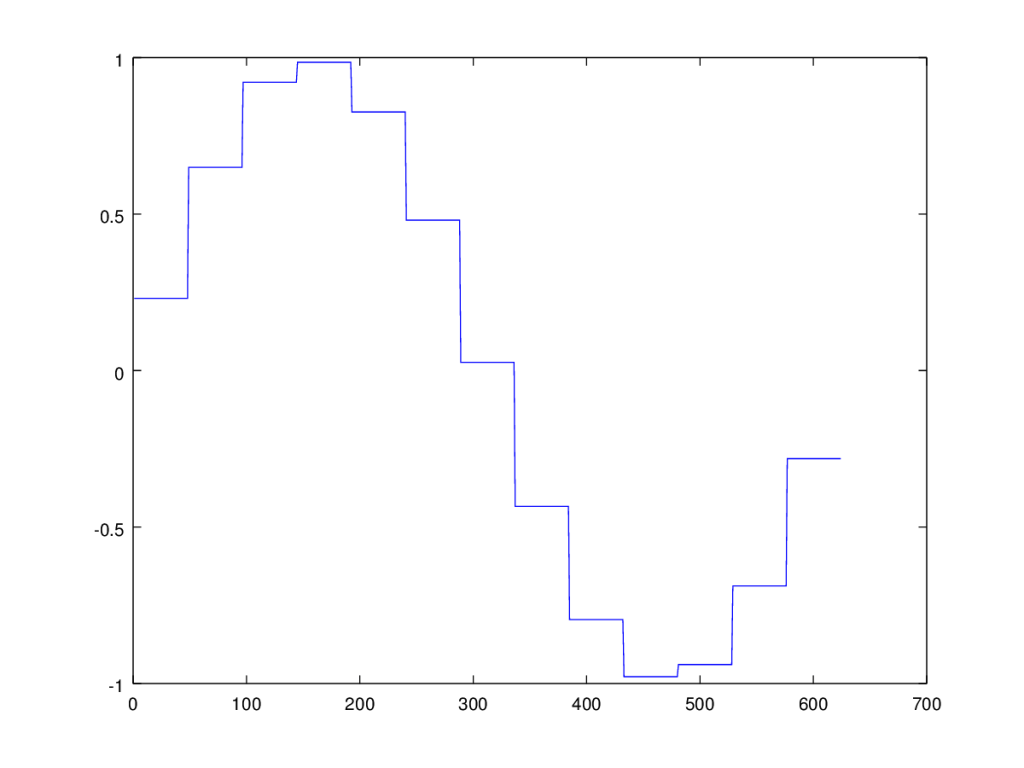
Below is the result of this process as applied to a simple sin wave in the plane, with the partitions generated by the algorithm on the left, and the resultant square wave produced by replacing each value with the average associated with the applicable region. Also attached is the Octave command line code.
Note that I made what is arguably a mathematical error in the function that partitions the time-series. Attached is a standalone function that accomplishes exactly this. Also attached is an algorithm that does the same given a fixed compression percentage.
Discover more from Information Overload
Subscribe to get the latest posts sent to your email.
